Usage
Using FREEDA GUI
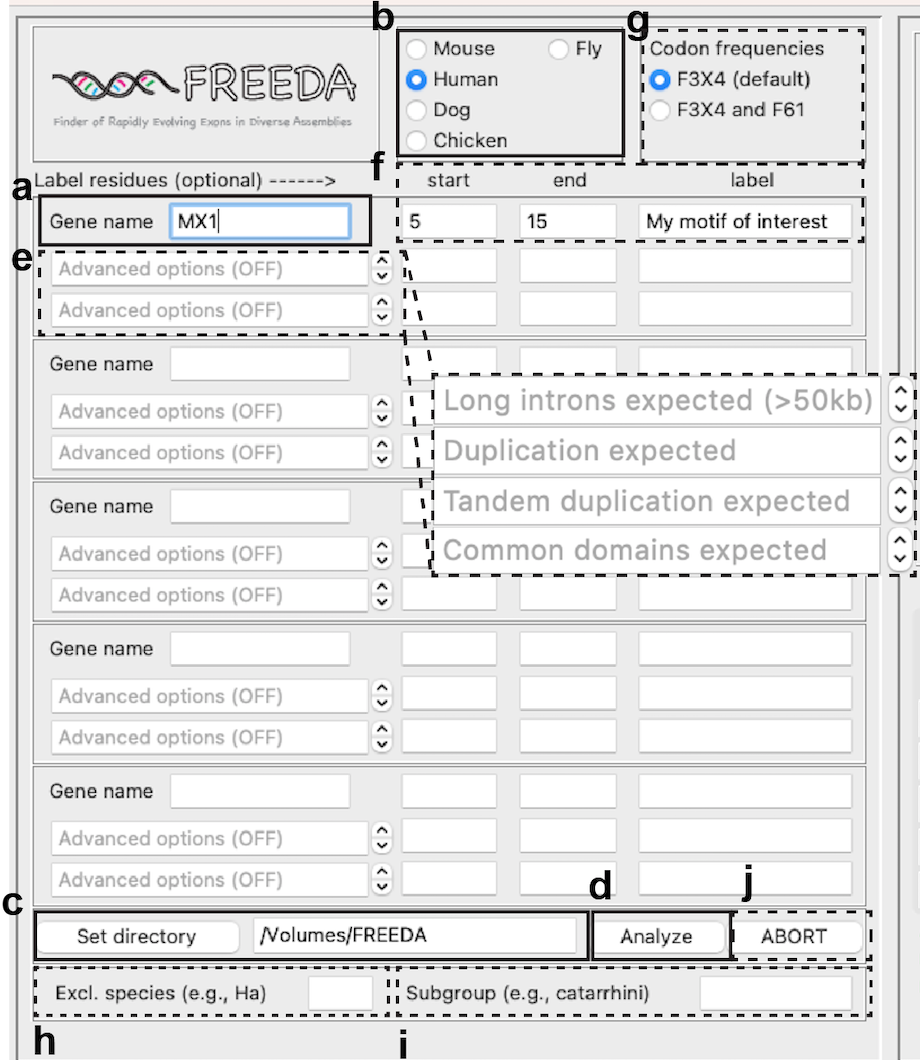
FREEDA's graphical user interface allows analyzing up to 5 genes at a time.
Depending on the specification of your computer, allocate about 1-2h per gene + 1-2h at first run to download genomes and make local blast databases. Fly analyzes are much faster because the genomes and genes are much smaller
Mandatory steps:
Provide gene name (e.g., MX1 gene encodes MxA protein; when in doubt consult: https://www.uniprot.org/)
Select reference species
Click "Set directory" (we recommend this to be an external drive).
Click "Analyze"
Optional steps:
Select Advanced Options (default OFF):
(We recommend visiting Ensembl or UniProt databases before using)
- Long introns expected (>50kb)
Increases recovery of full coding sequence but slows down the analysis by searching for exons further away from exact blast hits
- Duplication expected
Increases confidence in finding true orthologues but decreases recovery of full coding sequence by forcing that each exon must be syntenic at both ends
- Tandem duplication expected
Essential option for tandem duplications but decreases recovery of full coding sequence by restricting exon search to regions closest to exact blast hits
- Common domains expected
Speeds up the analysis but may miss divergent exons by raising similarity threshold for blast from 60% to 80%
Label residues (the region of interest will be labeled and colored in the protein structure)
Codon frequencies (default F3X4)
(We recommend consulting PAML User Guide: http://abacus.gene.ucl.ac.uk/software/paml.html)
Exclude species (recommended in case of observing frameshifts in the alignment - see Understanding Results - use abbreviation listed here: Genomic assemblies used e.g. Gd for Grammomys dolichurus)
Subgroup (you can opt to analyze a specific clade: hominoidea, catarrhini, caniformia and melanogaster are available; make sure to select the matching reference species)
ABORT (generally not recommended but useful to instantly stop the analysis - it shuts down the whole app)
TIPS:
Stable Internet connection allows smooth download of all genomes (see Troubleshooting).
If analyzing vertebrates: allocate 1-2h per gene (depending on your computer's CPU and RAM) + 1-2h at first run to download genomes and make local blast databases.
Large genes (>100kb) will take longer (hours) to analyze. Protein size matters less.
Make a dedicated folder for FREEDA (and always use the same one to avoid downloading genomes again)
- You can scroll text in the Events Window up-down and left-right
...NOTE... : - this indicates information for the user - no action needed
...WARNING... : - this indicates suboptimal behavior - no action needed (see Troubleshooting).
...FATAL ERROR... : - this indicates critical failure - action needed (see Troubleshooting).
Putting your computer to sleep should not interfere with the analysis (will resume after awaking).
We recommend the free software UNIPRO by Ugene for viewing alignment files http://ugene.net/download-all.html.
When opening structure files (.pse) with PyMOL you can click "Skip activation" - no license is ever needed to view the structure files.
If you downloaded a new FREEDA release - its safest to remove all text (.txt) files from the main folder
Understanding Events Window
FIRST RUN ONLY:
If running on MacOS, FREEDA will prompt the user to download PyMOL from https://pymol.org/
FREEDA will first download Ensembl release information for a chosen taxon needed for input extraction (lots of text)
Next FREEDA will download and decompress the reference genome for selected taxon (this will take several minutes depending on Internet speed)
Next FREEDA will download, decompress genomic related assemblies and create local blast databases for each (allow 1-2h for this step dependent on Internet speed)
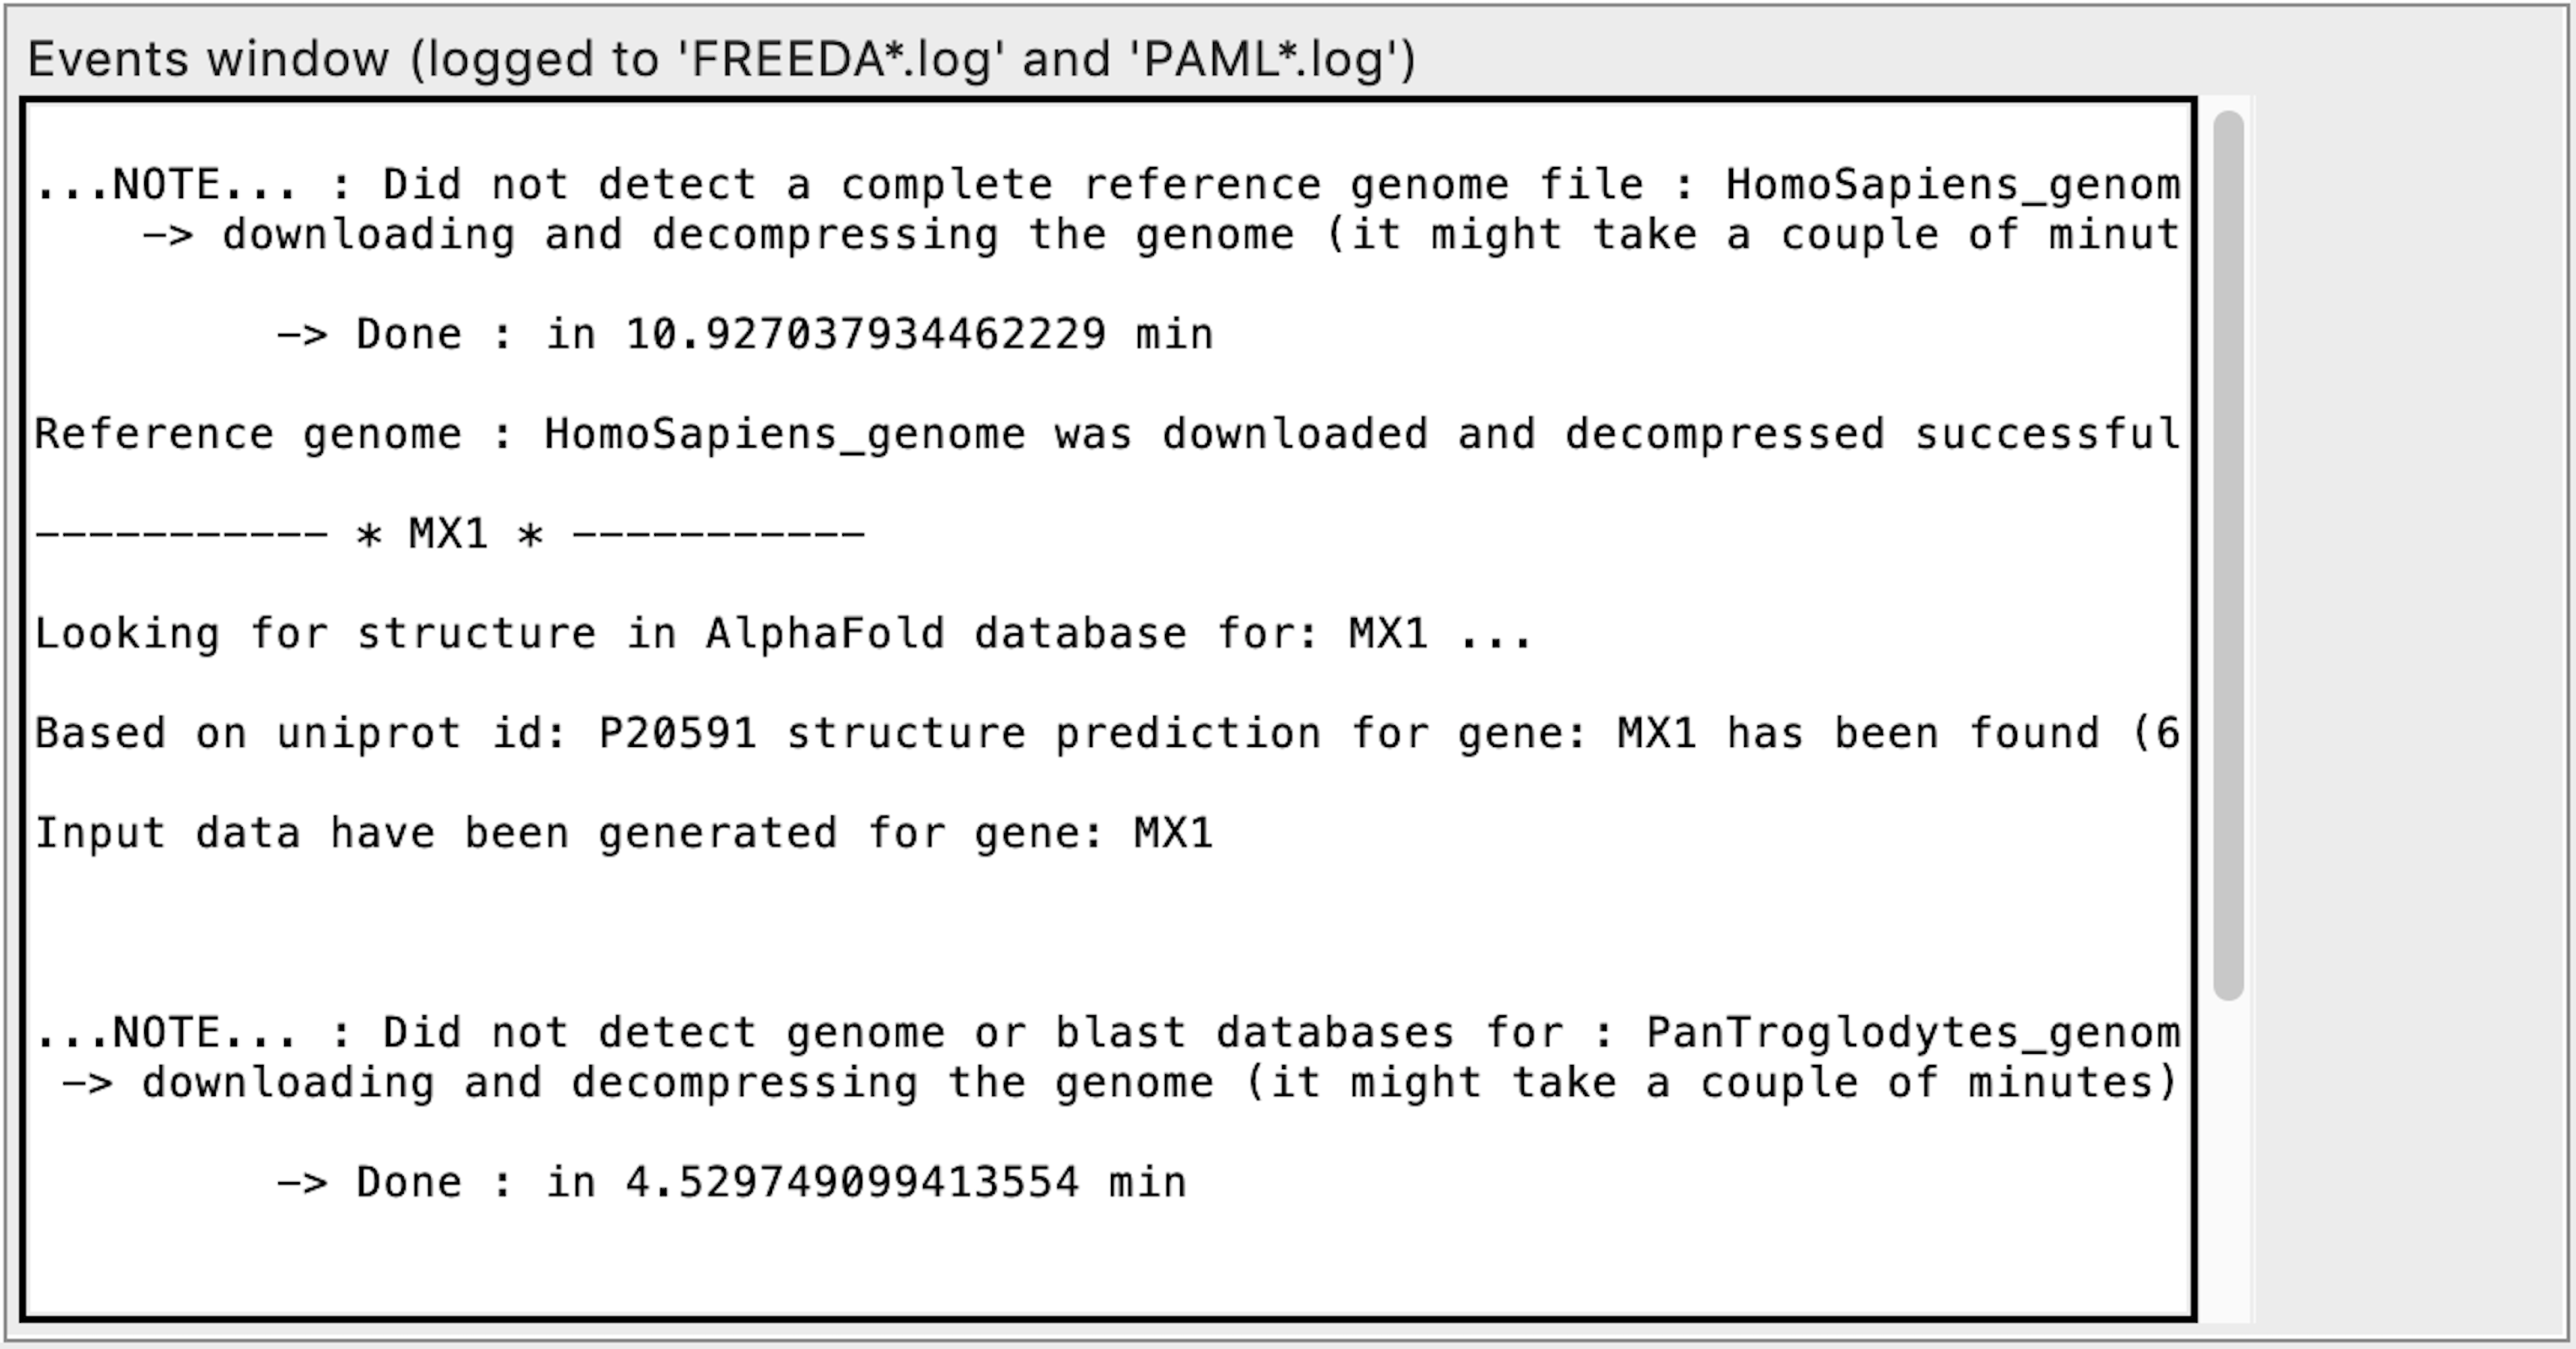
There will be 18-22 genomic assemblies downloaded for each selected taxon unless you specified a subgroup. This step is triggered each time you select a new working directory ("Set directory" in GUI)!
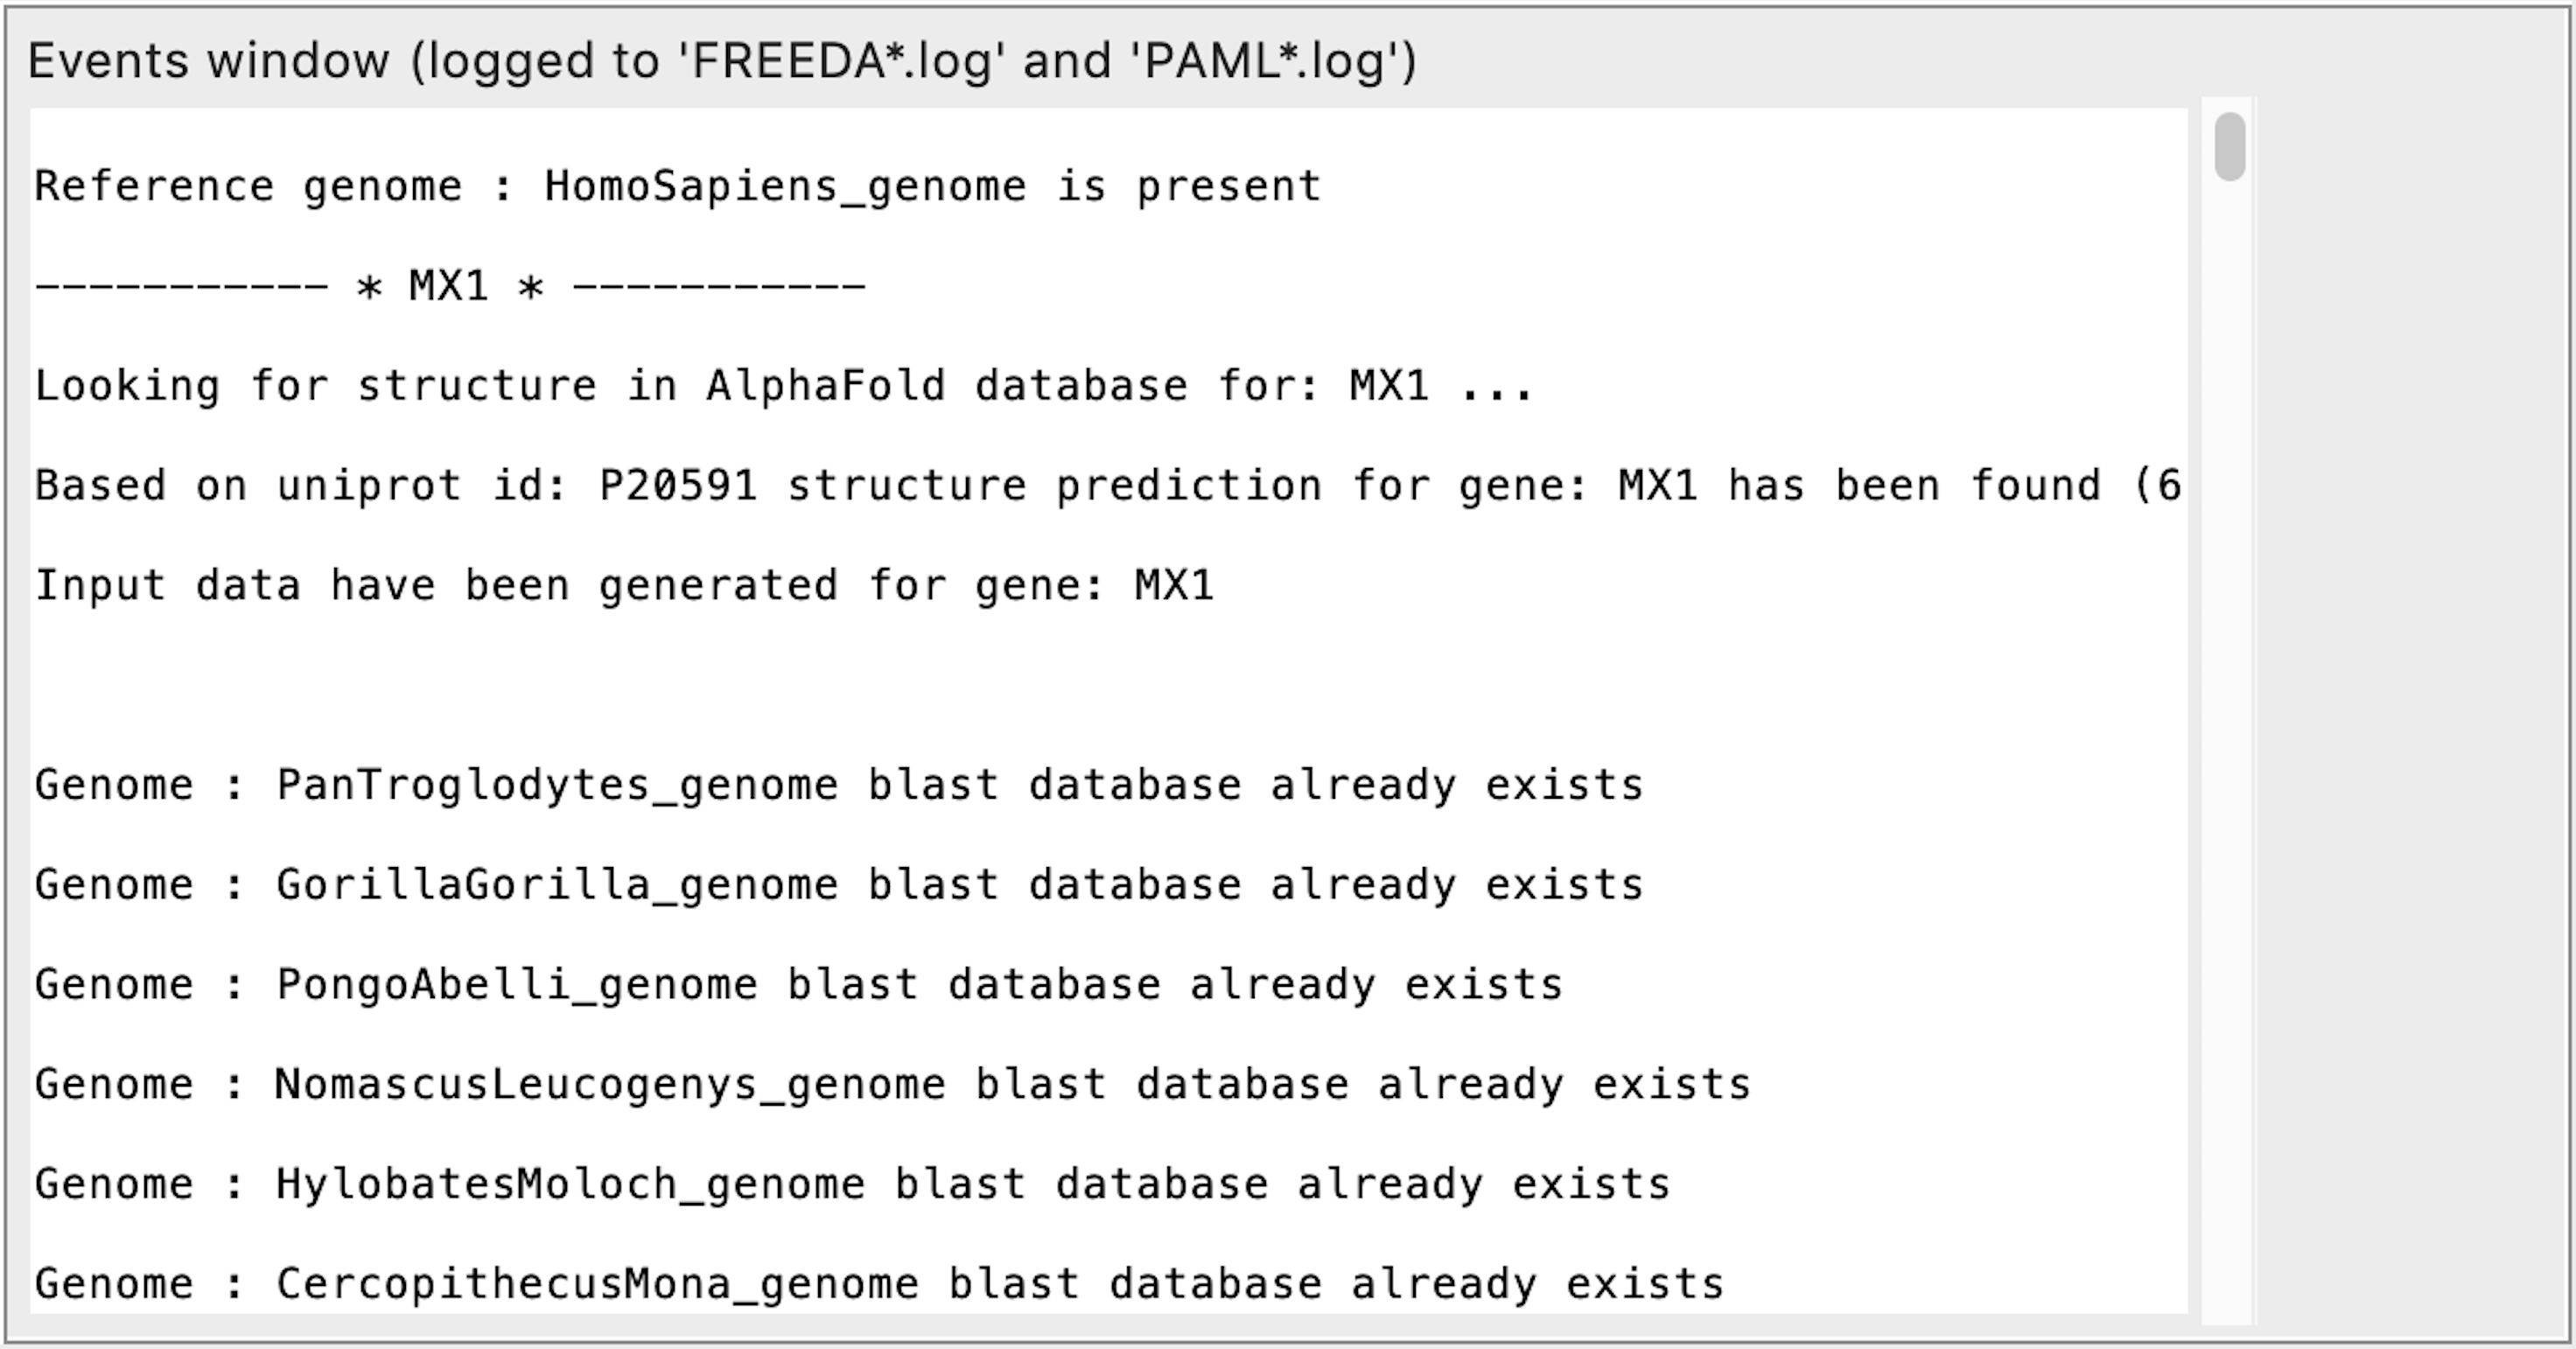
EACH TIME
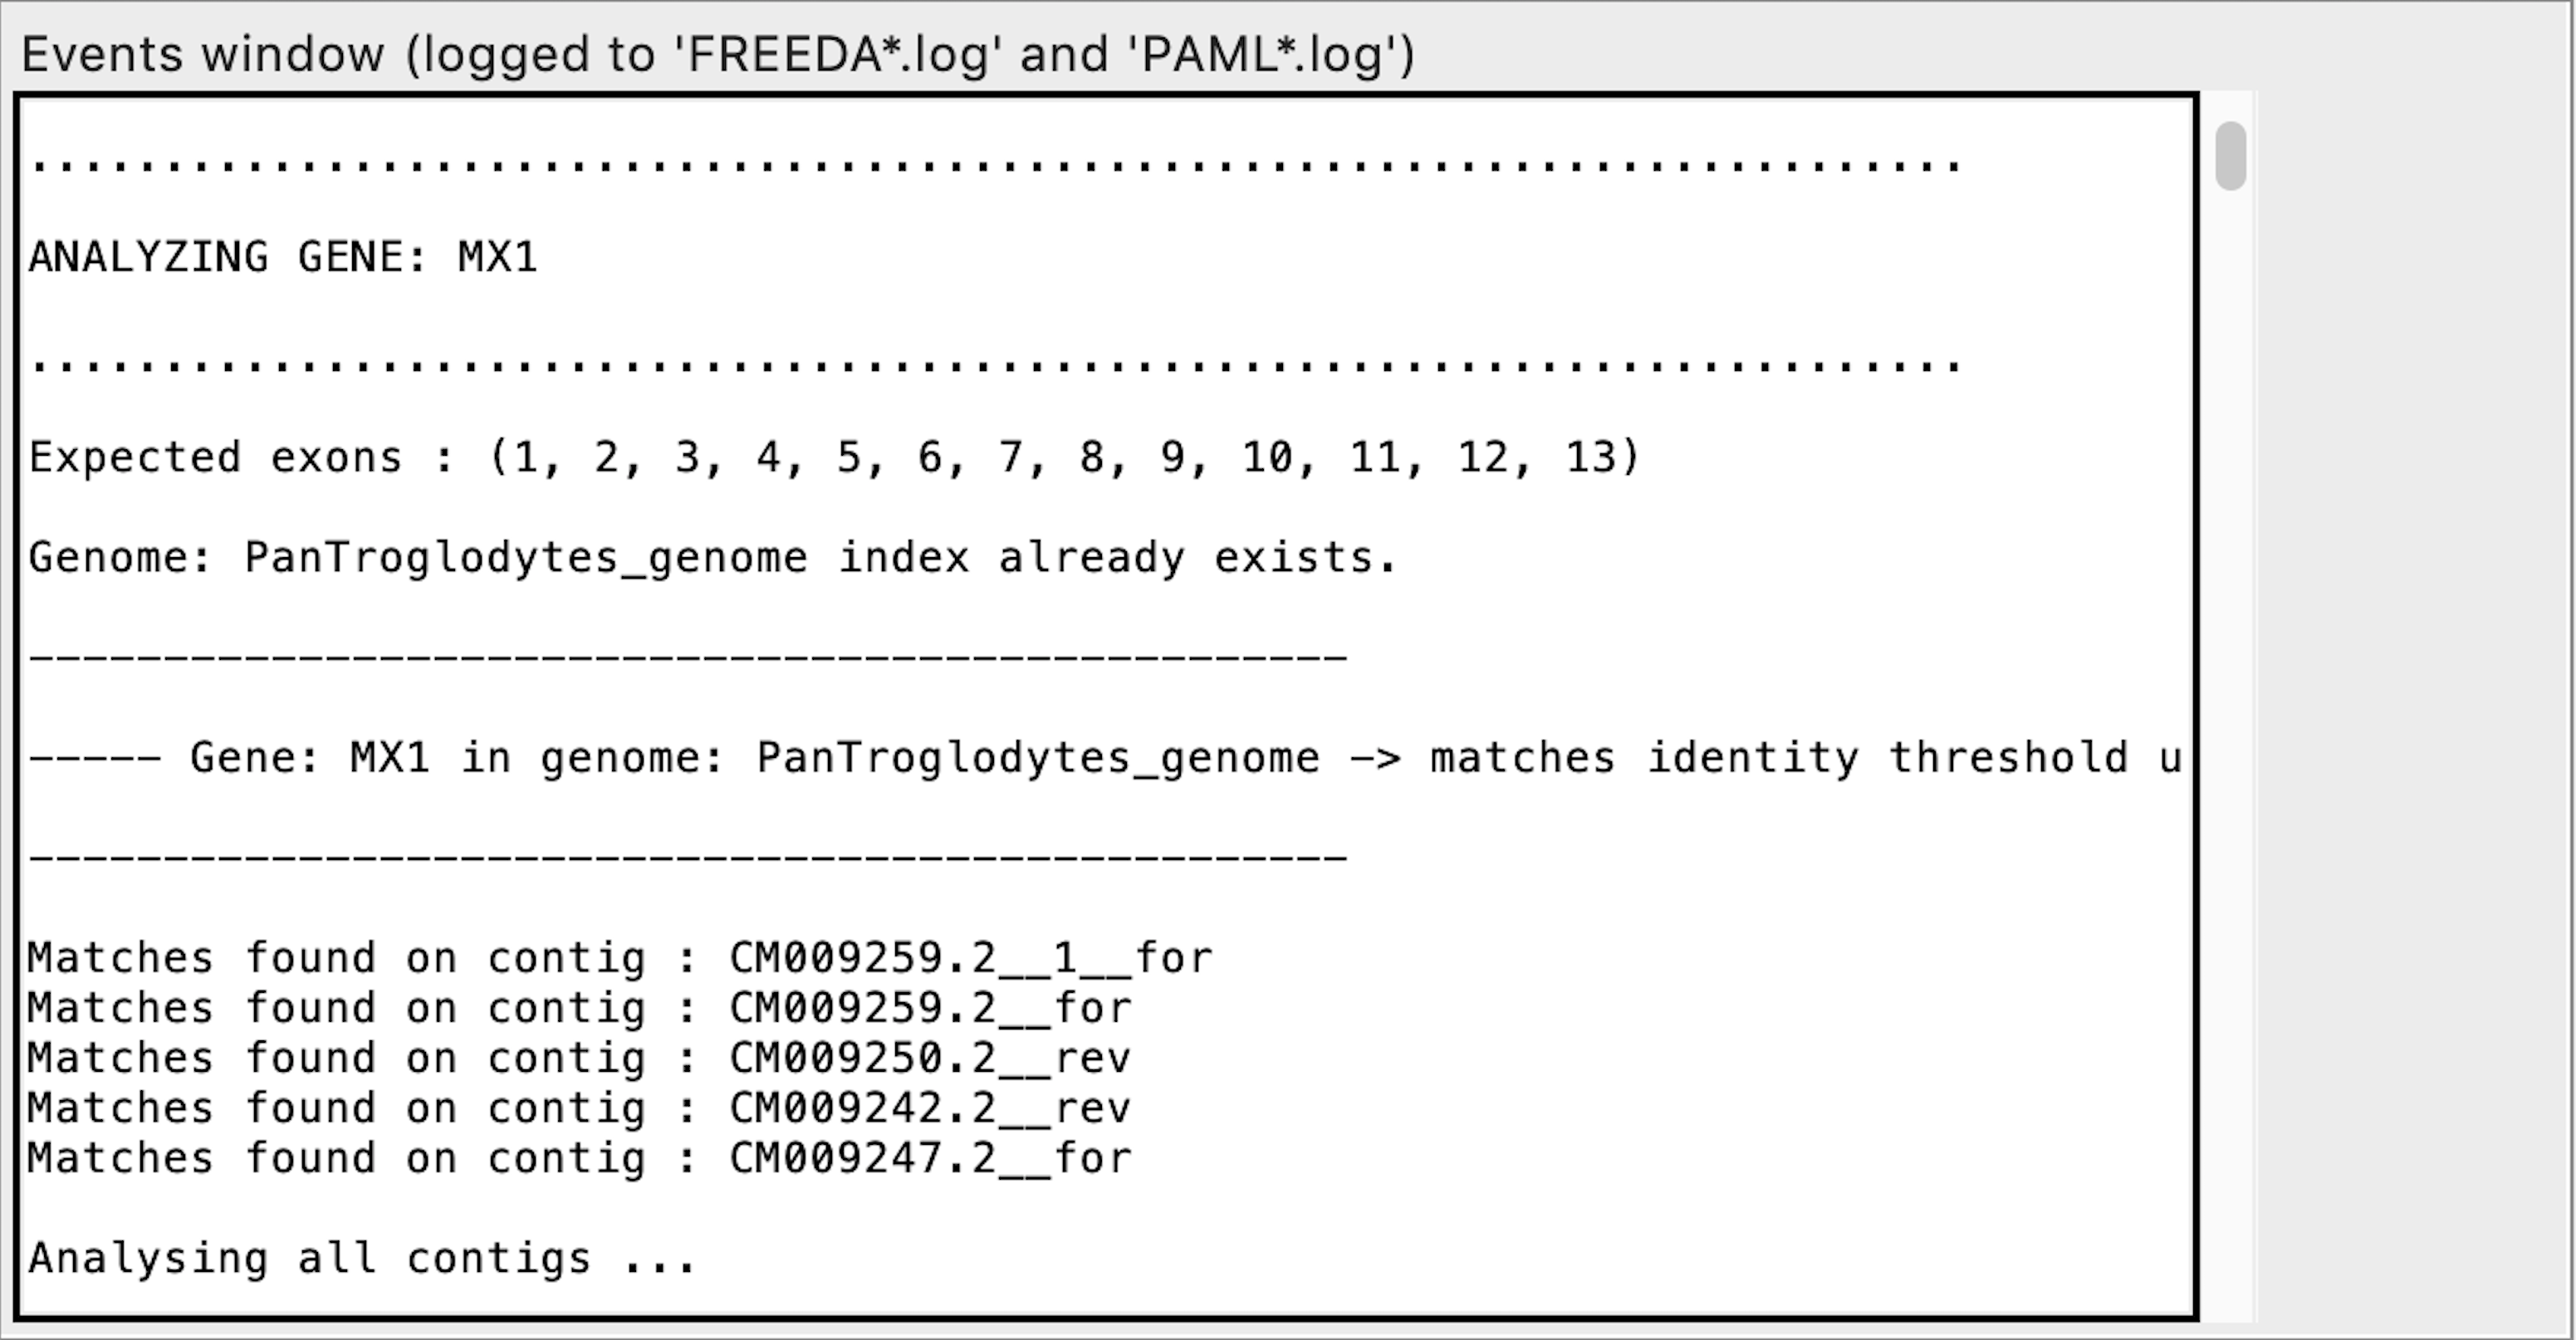
Checking for genomic assemblies and input extraction
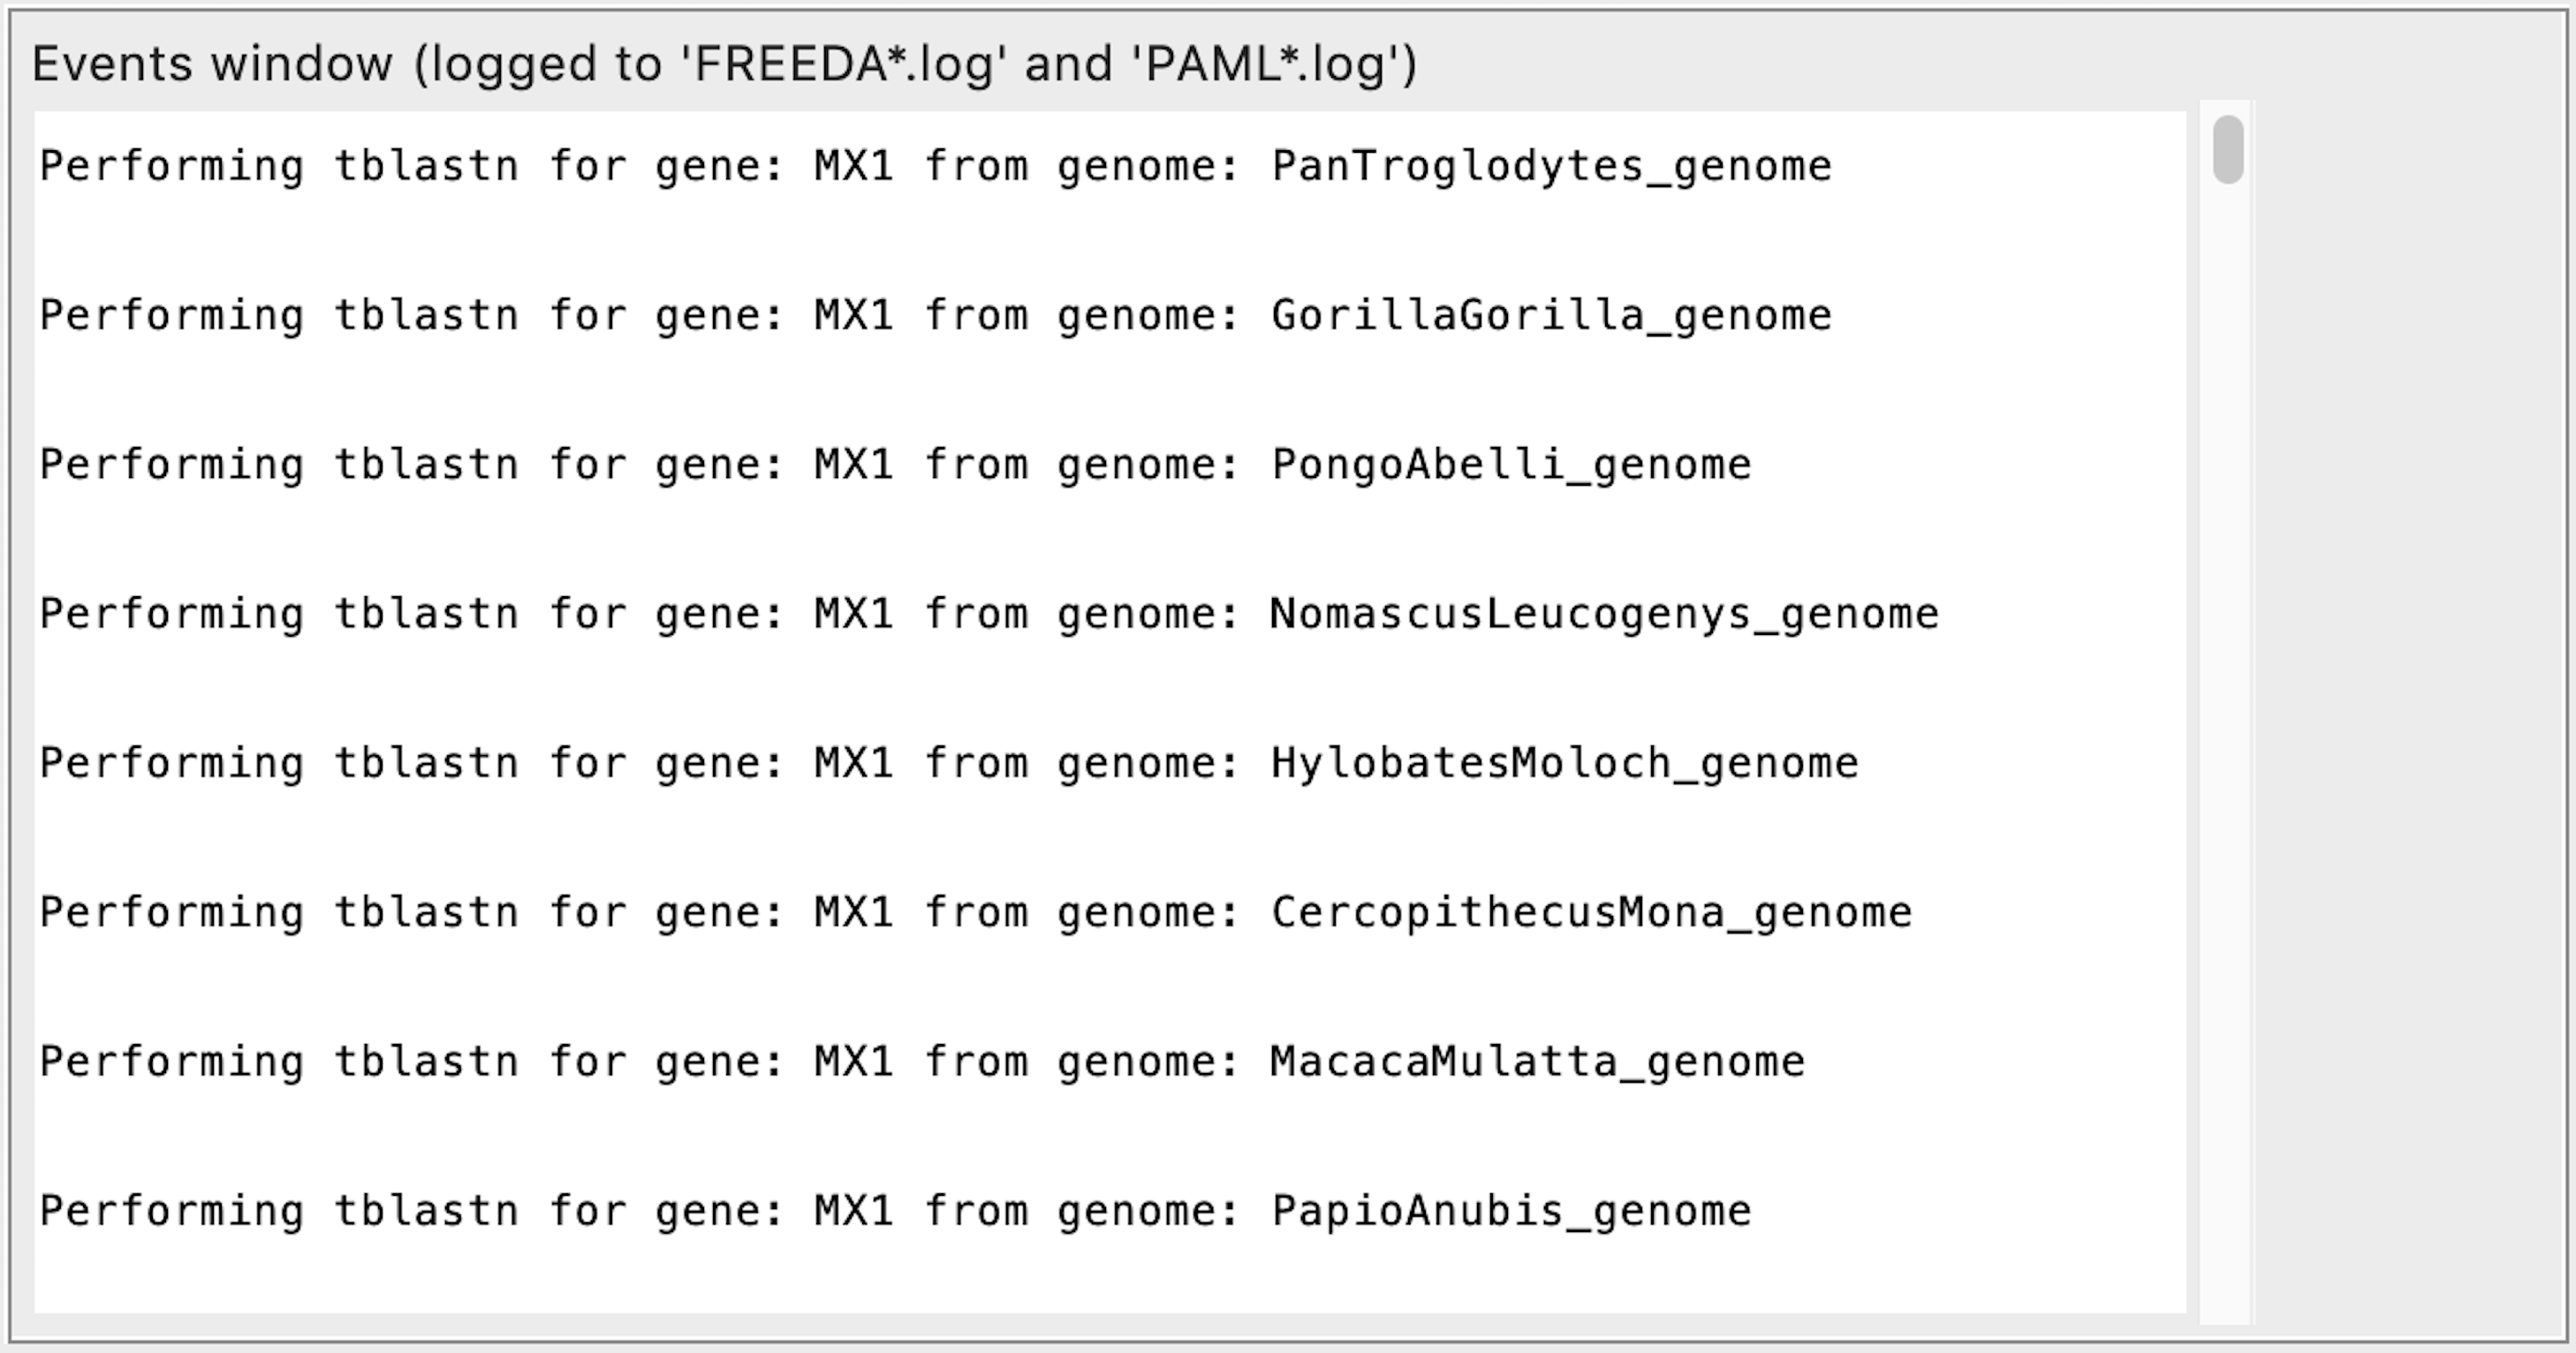
Searching for homologous sequences using blast
Parsing blast results into separate contigs
Initial alignment of each contig

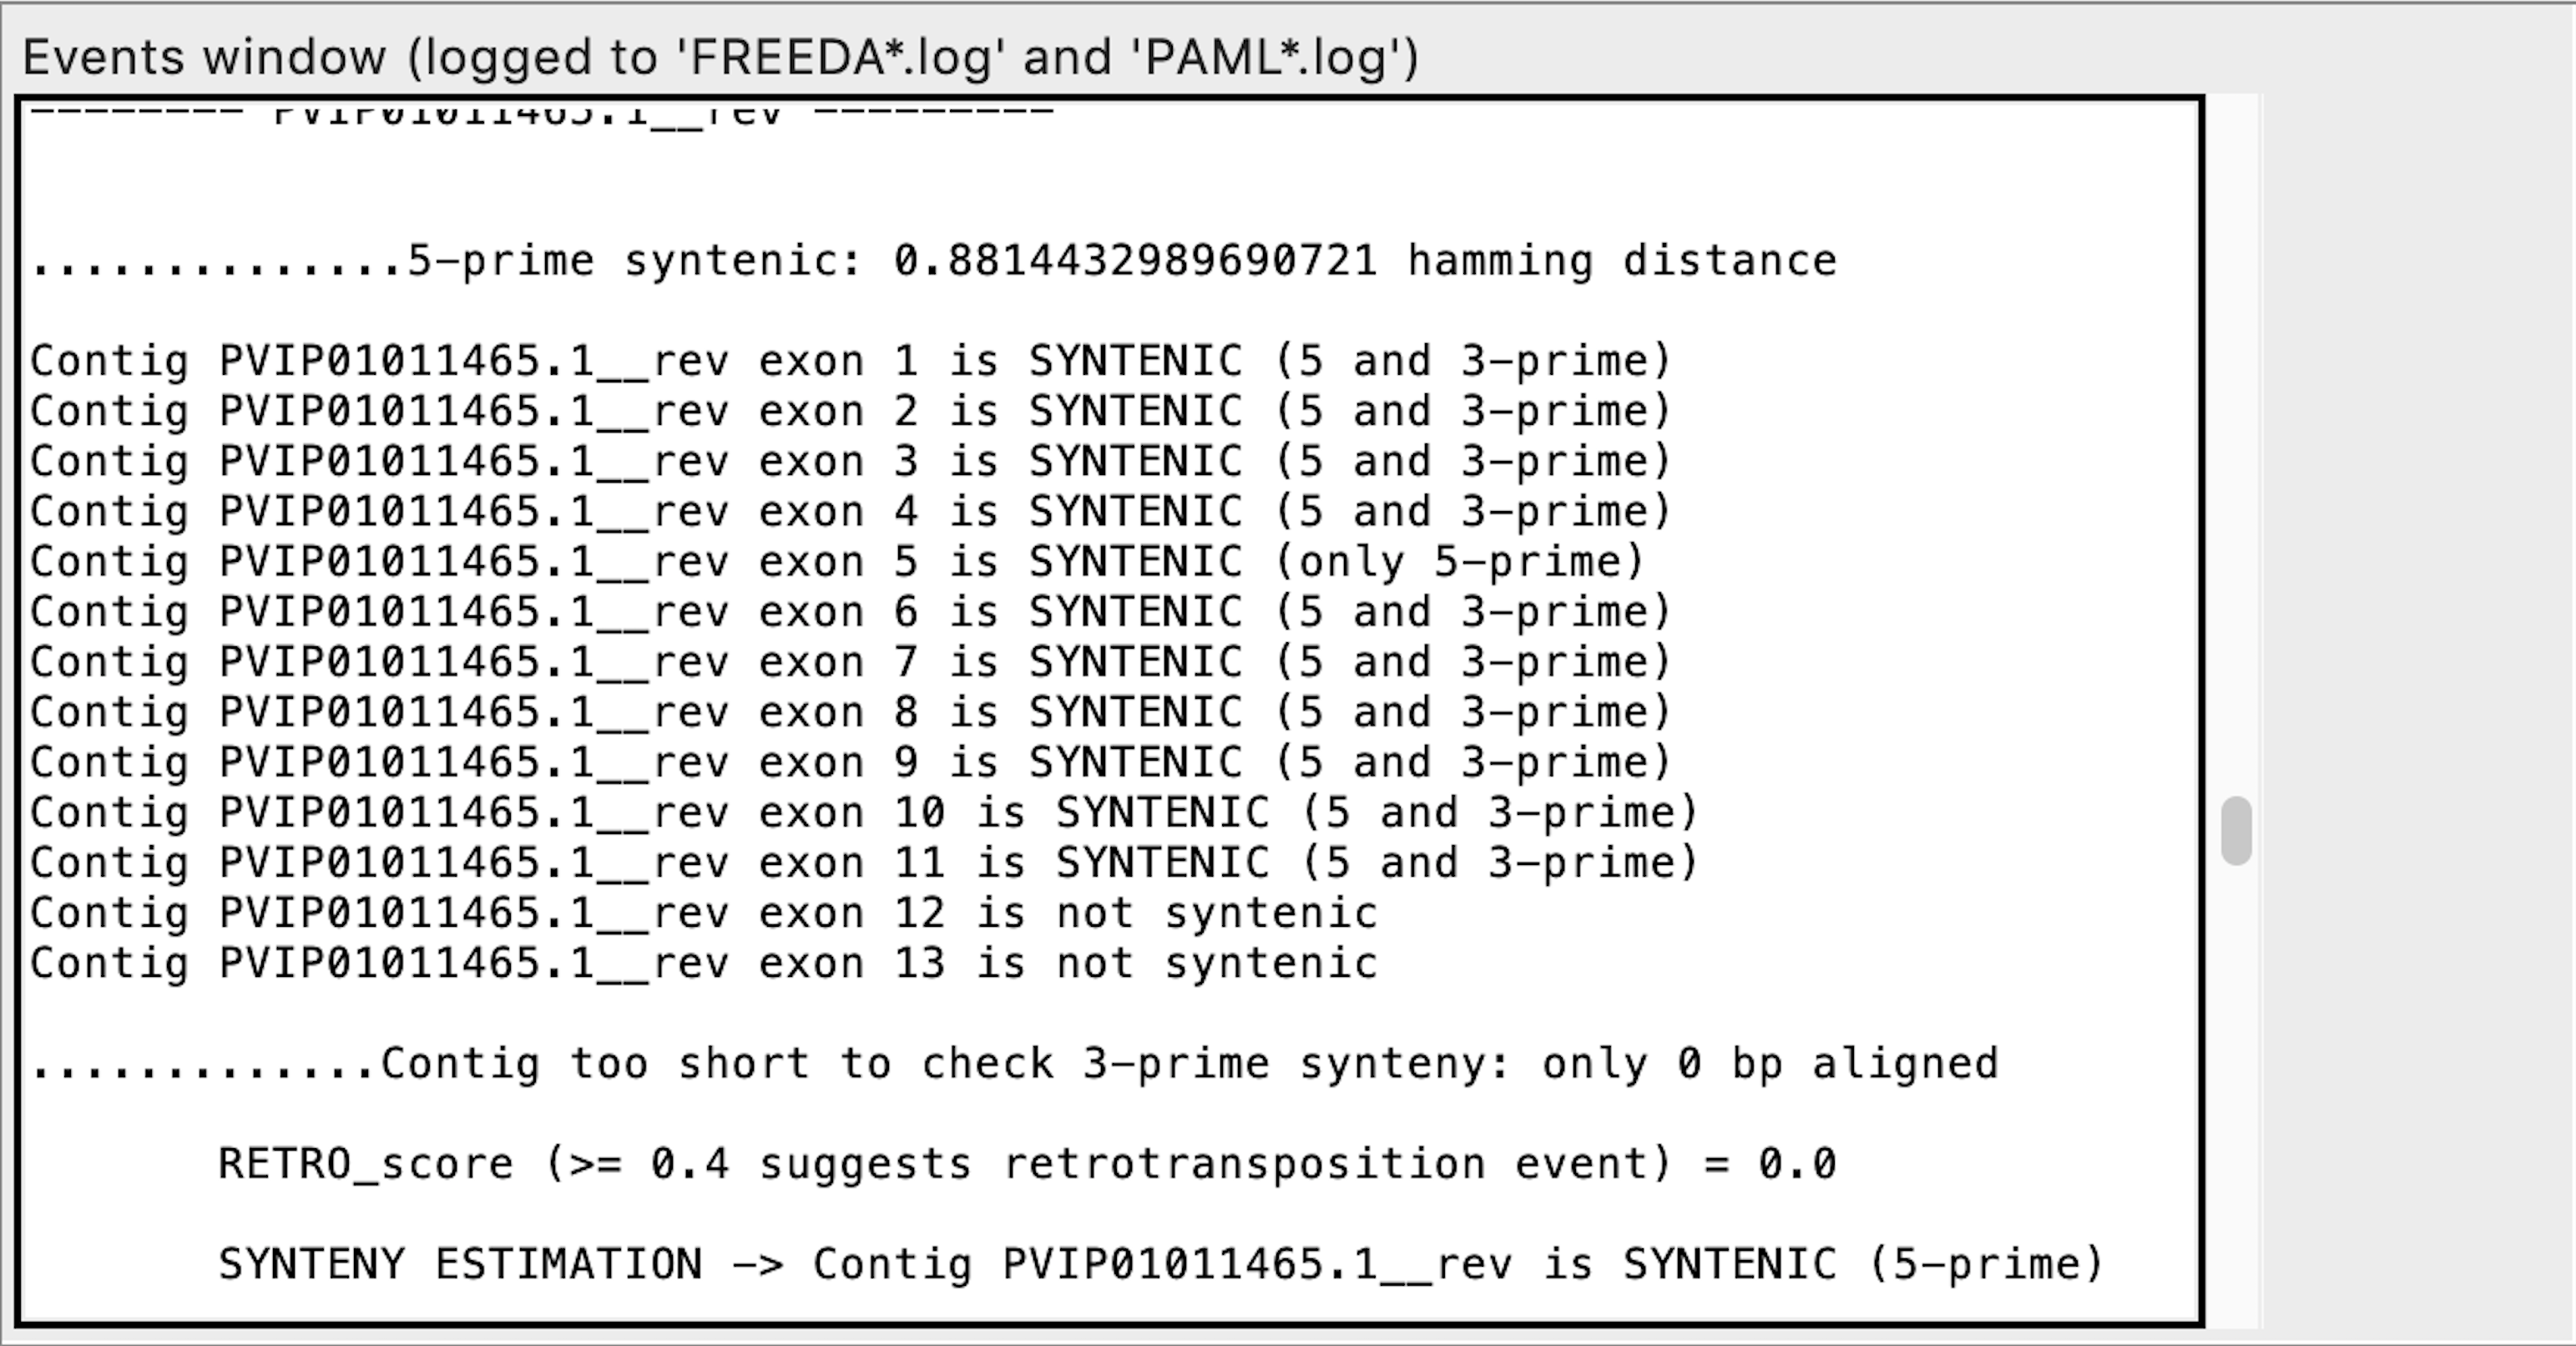
Exon calling - this contig does not contain any syntenic exons expected
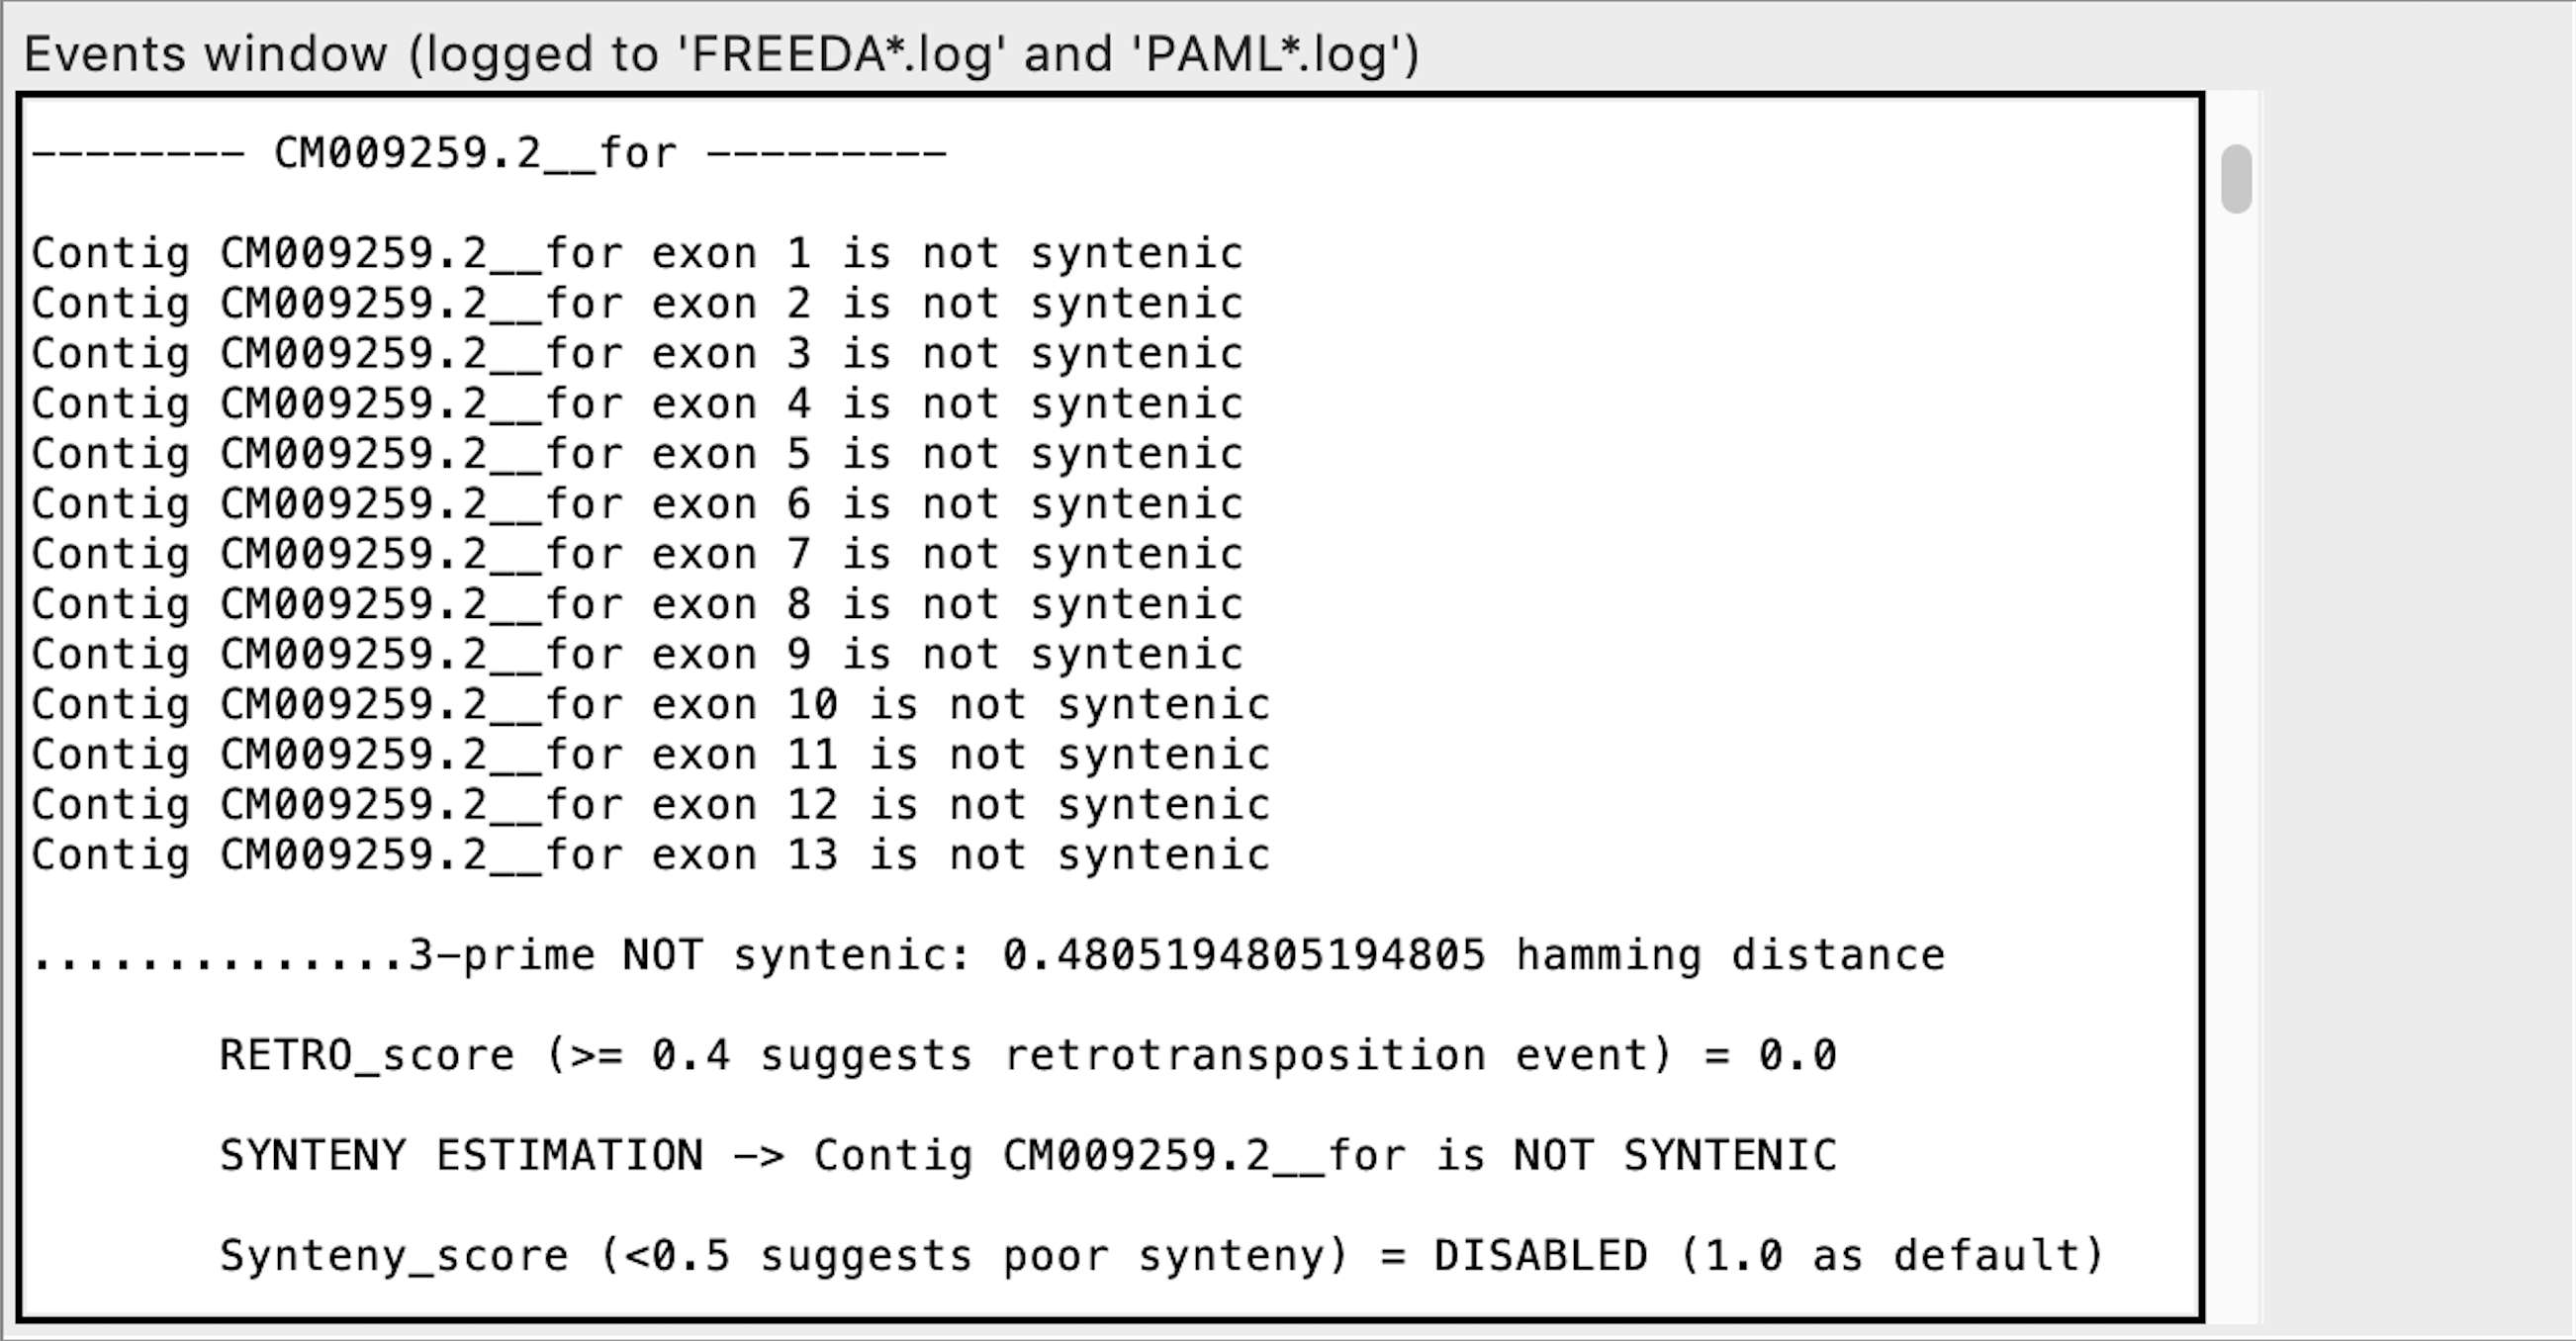
When analyzing the alignment FREEDA considers any alignable chunk of DNA a possible "exon" since it bears some similarity to the blasted reference coding sequence. Calling such exon "not syntenic" means that this chunk of DNA does not bear synteny to the reference locus (does not have recognizable introns). FREEDA does not explicitly tests if that chunk of DNA is a duplication but rather rejects it as an orthologous sequence.
Notice "Synteny_score" is DISABLED. It can be enabled by selecting "Duplication expected" advanced option in the GUI. "Synteny_score" is a ratio of exons syntenic at both ends (5 and 3 prime) to all possibly syntenic exons (e.g. synteny found only at 3 prime). "Synteny_score" is not required to call synteny for an exon or contig - it helps distinguish recent duplications whose surrounding locus has not yet significantly diverged.
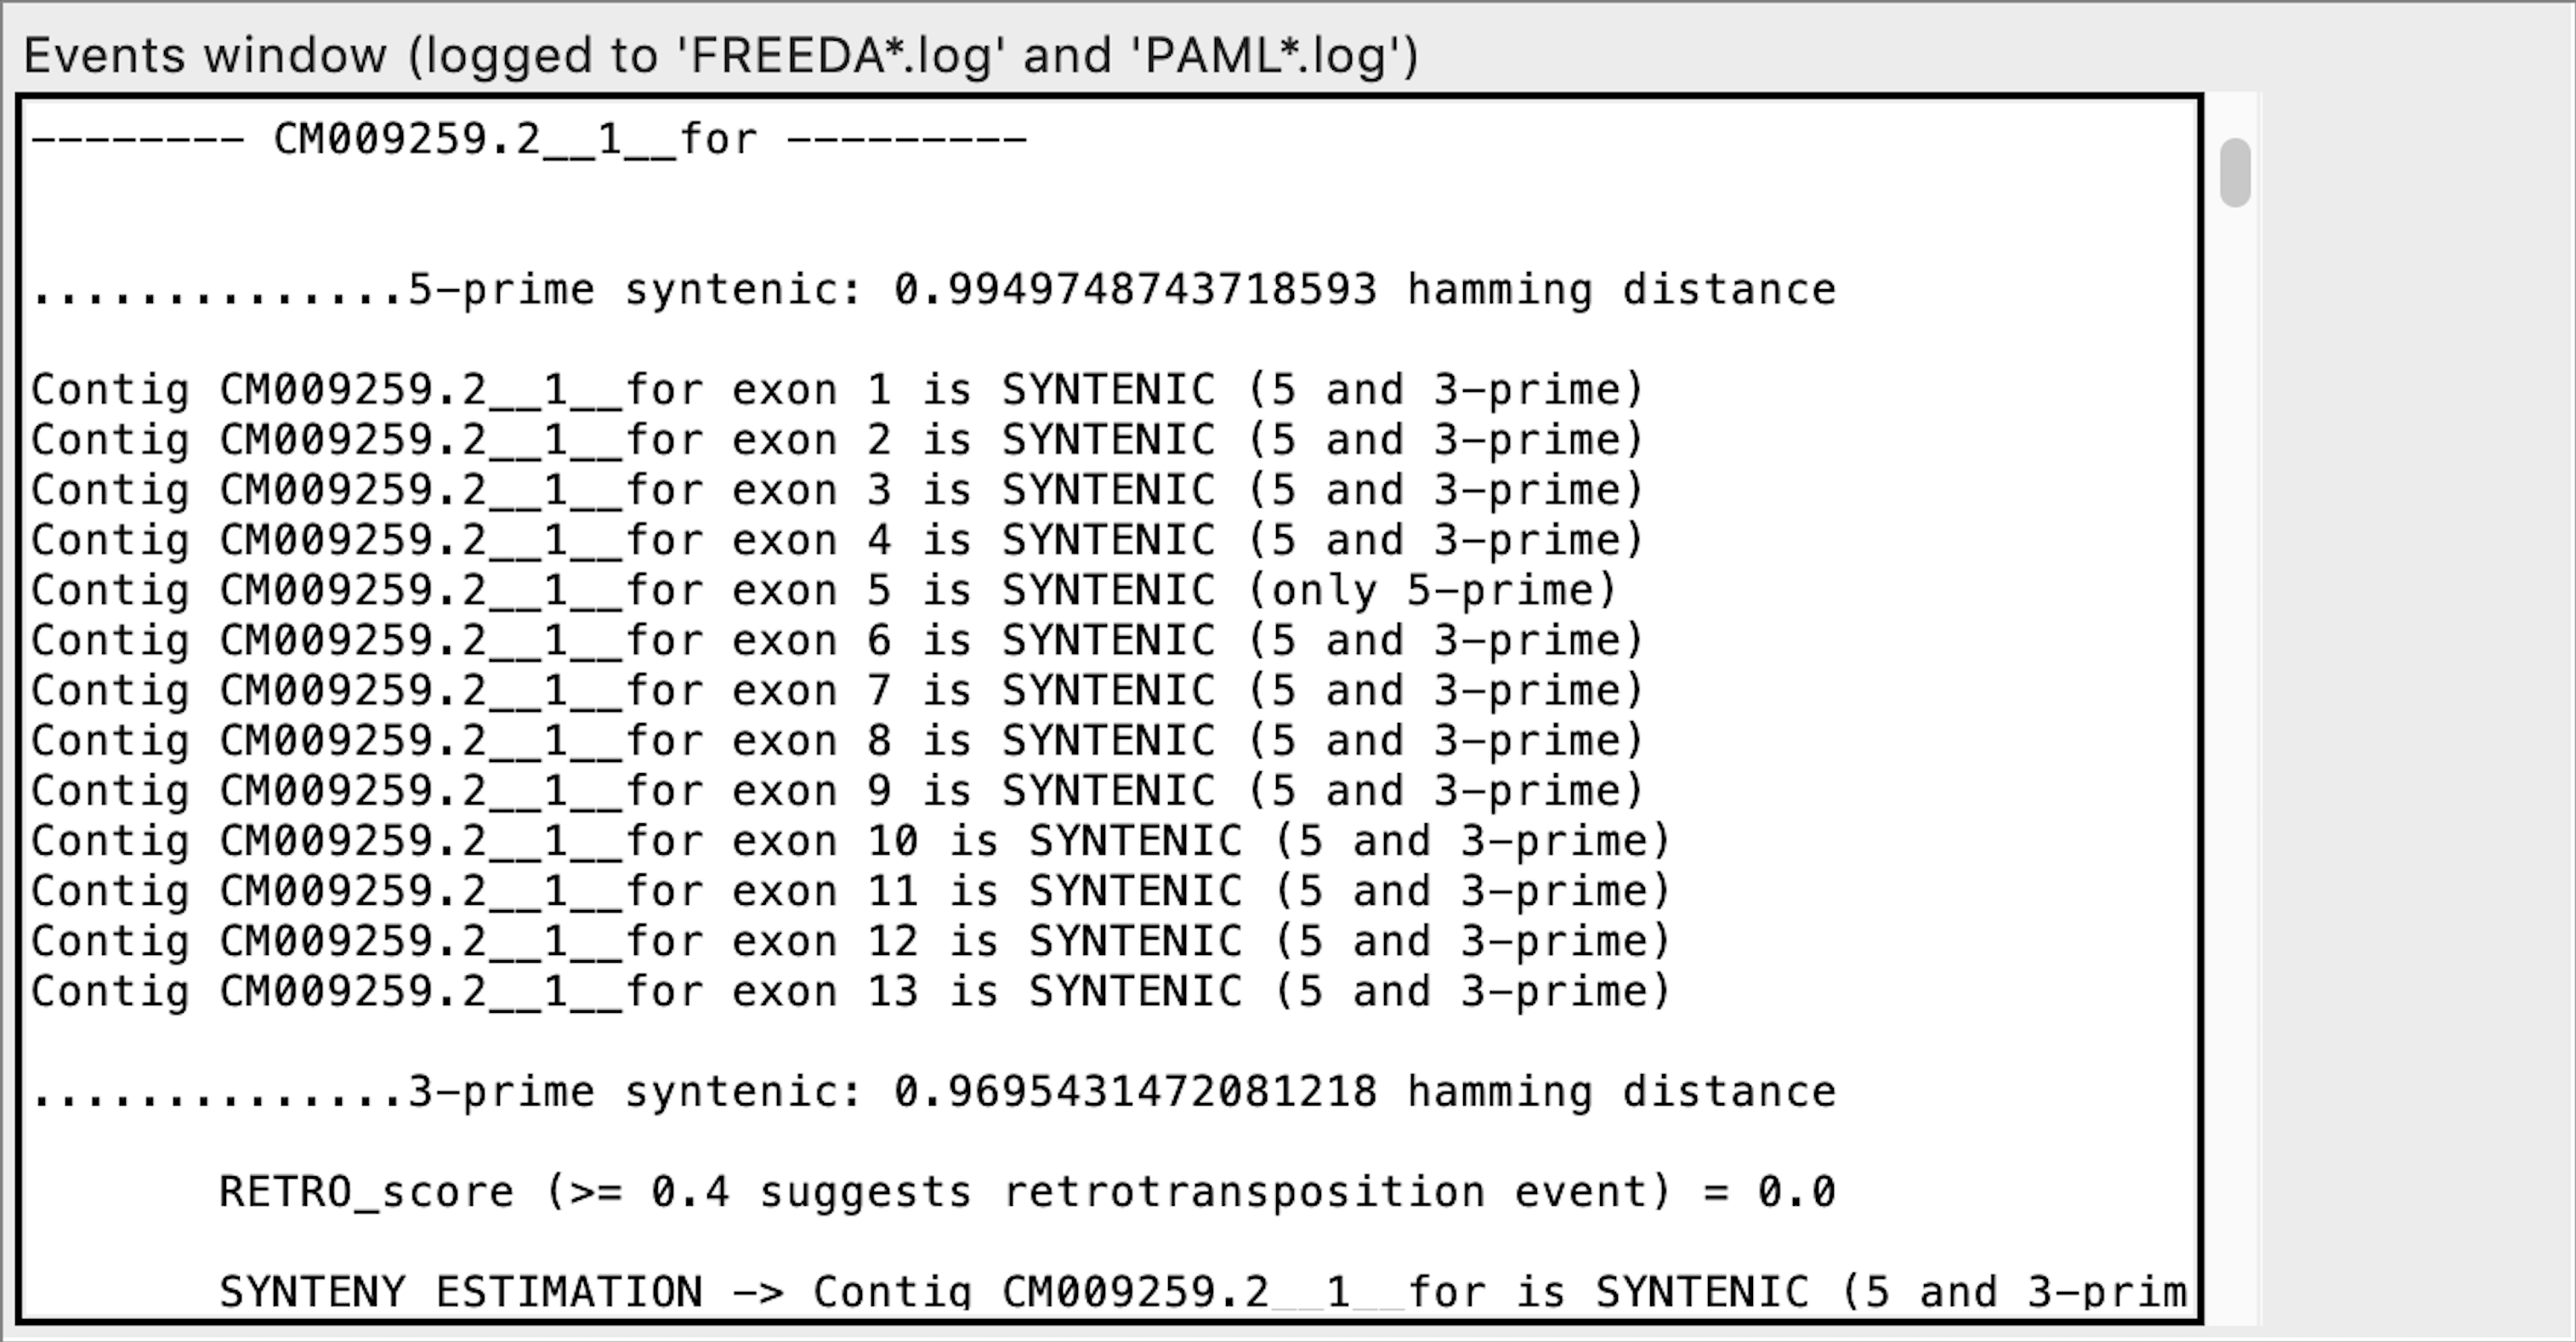
Exon calling - this contig contains all syntenic exons expected
Exon calling - this contig may contain a retro-duplication
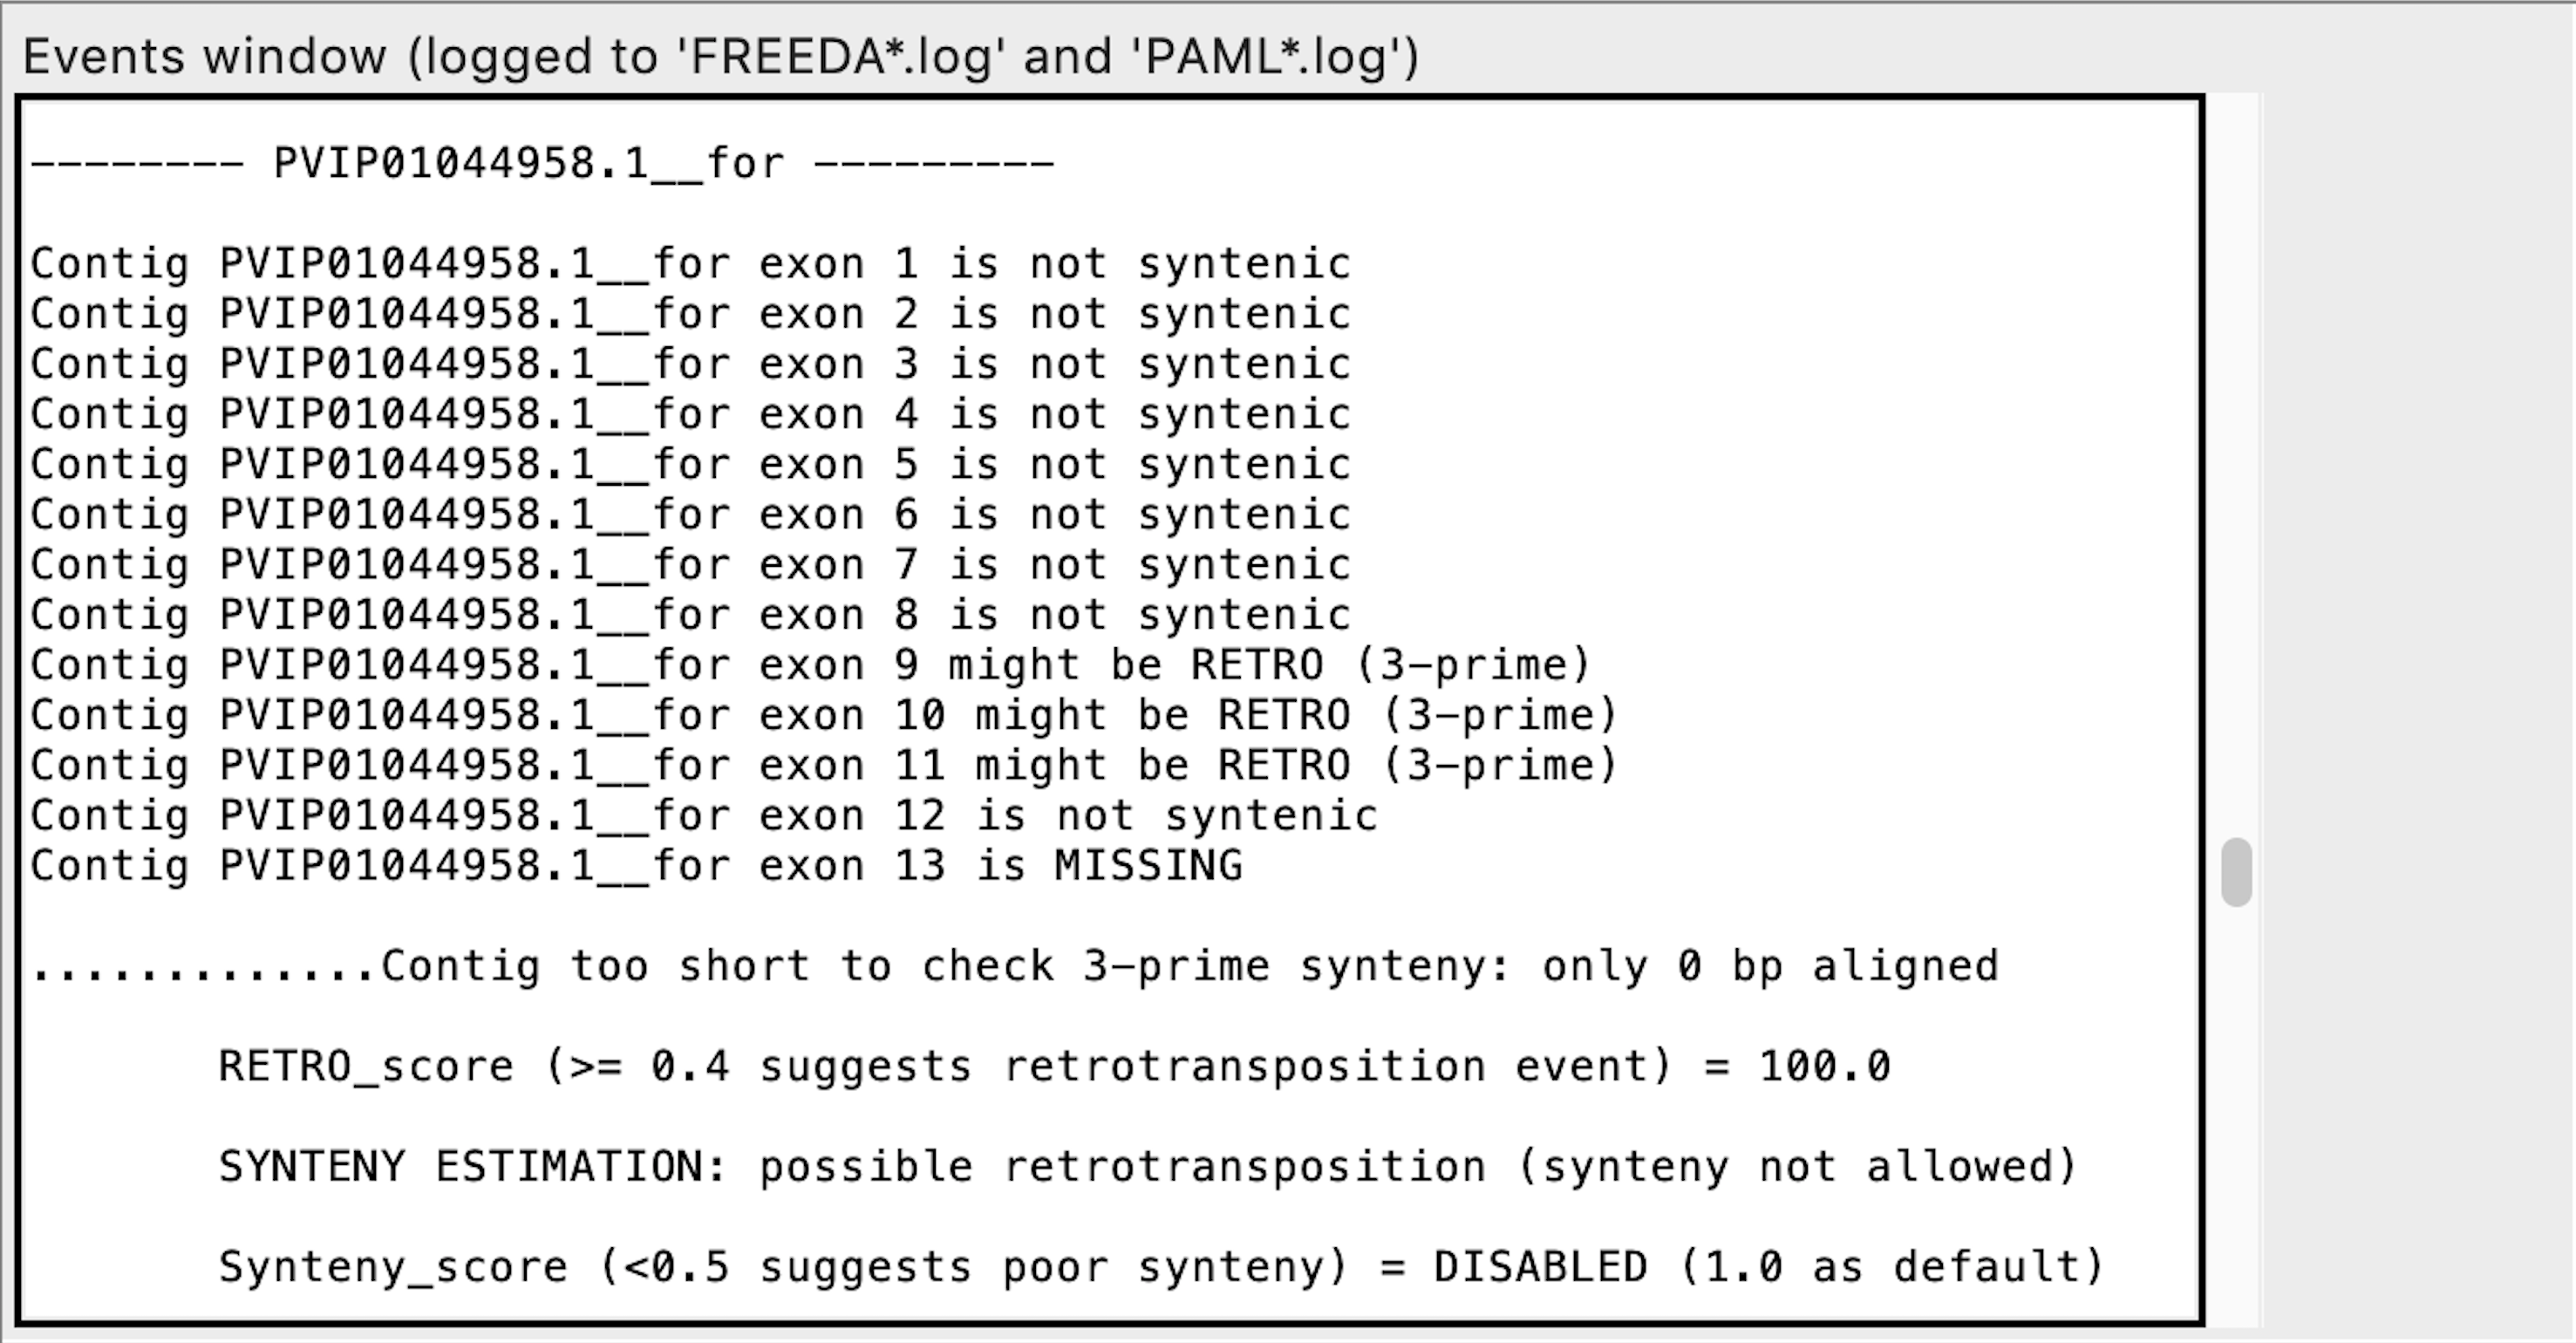
We urge manual verification of the raw alignment of that specific contig to ensure that the contig contains a retro-duplication (see below). "RETRO_score" is a ratio of exons that are potentially retro-duplicated and syntenic exons. However, if no potential exons are found in the contig, even a single exon flagged as possibly "RETRO" raises "RETRO_score" to a maximum (100). "RETRO_score" is always enabled.
Exon calling - this contig does not have the last two syntenic exons expected
Exon calling - this contig contains only the last two syntenic exons expected
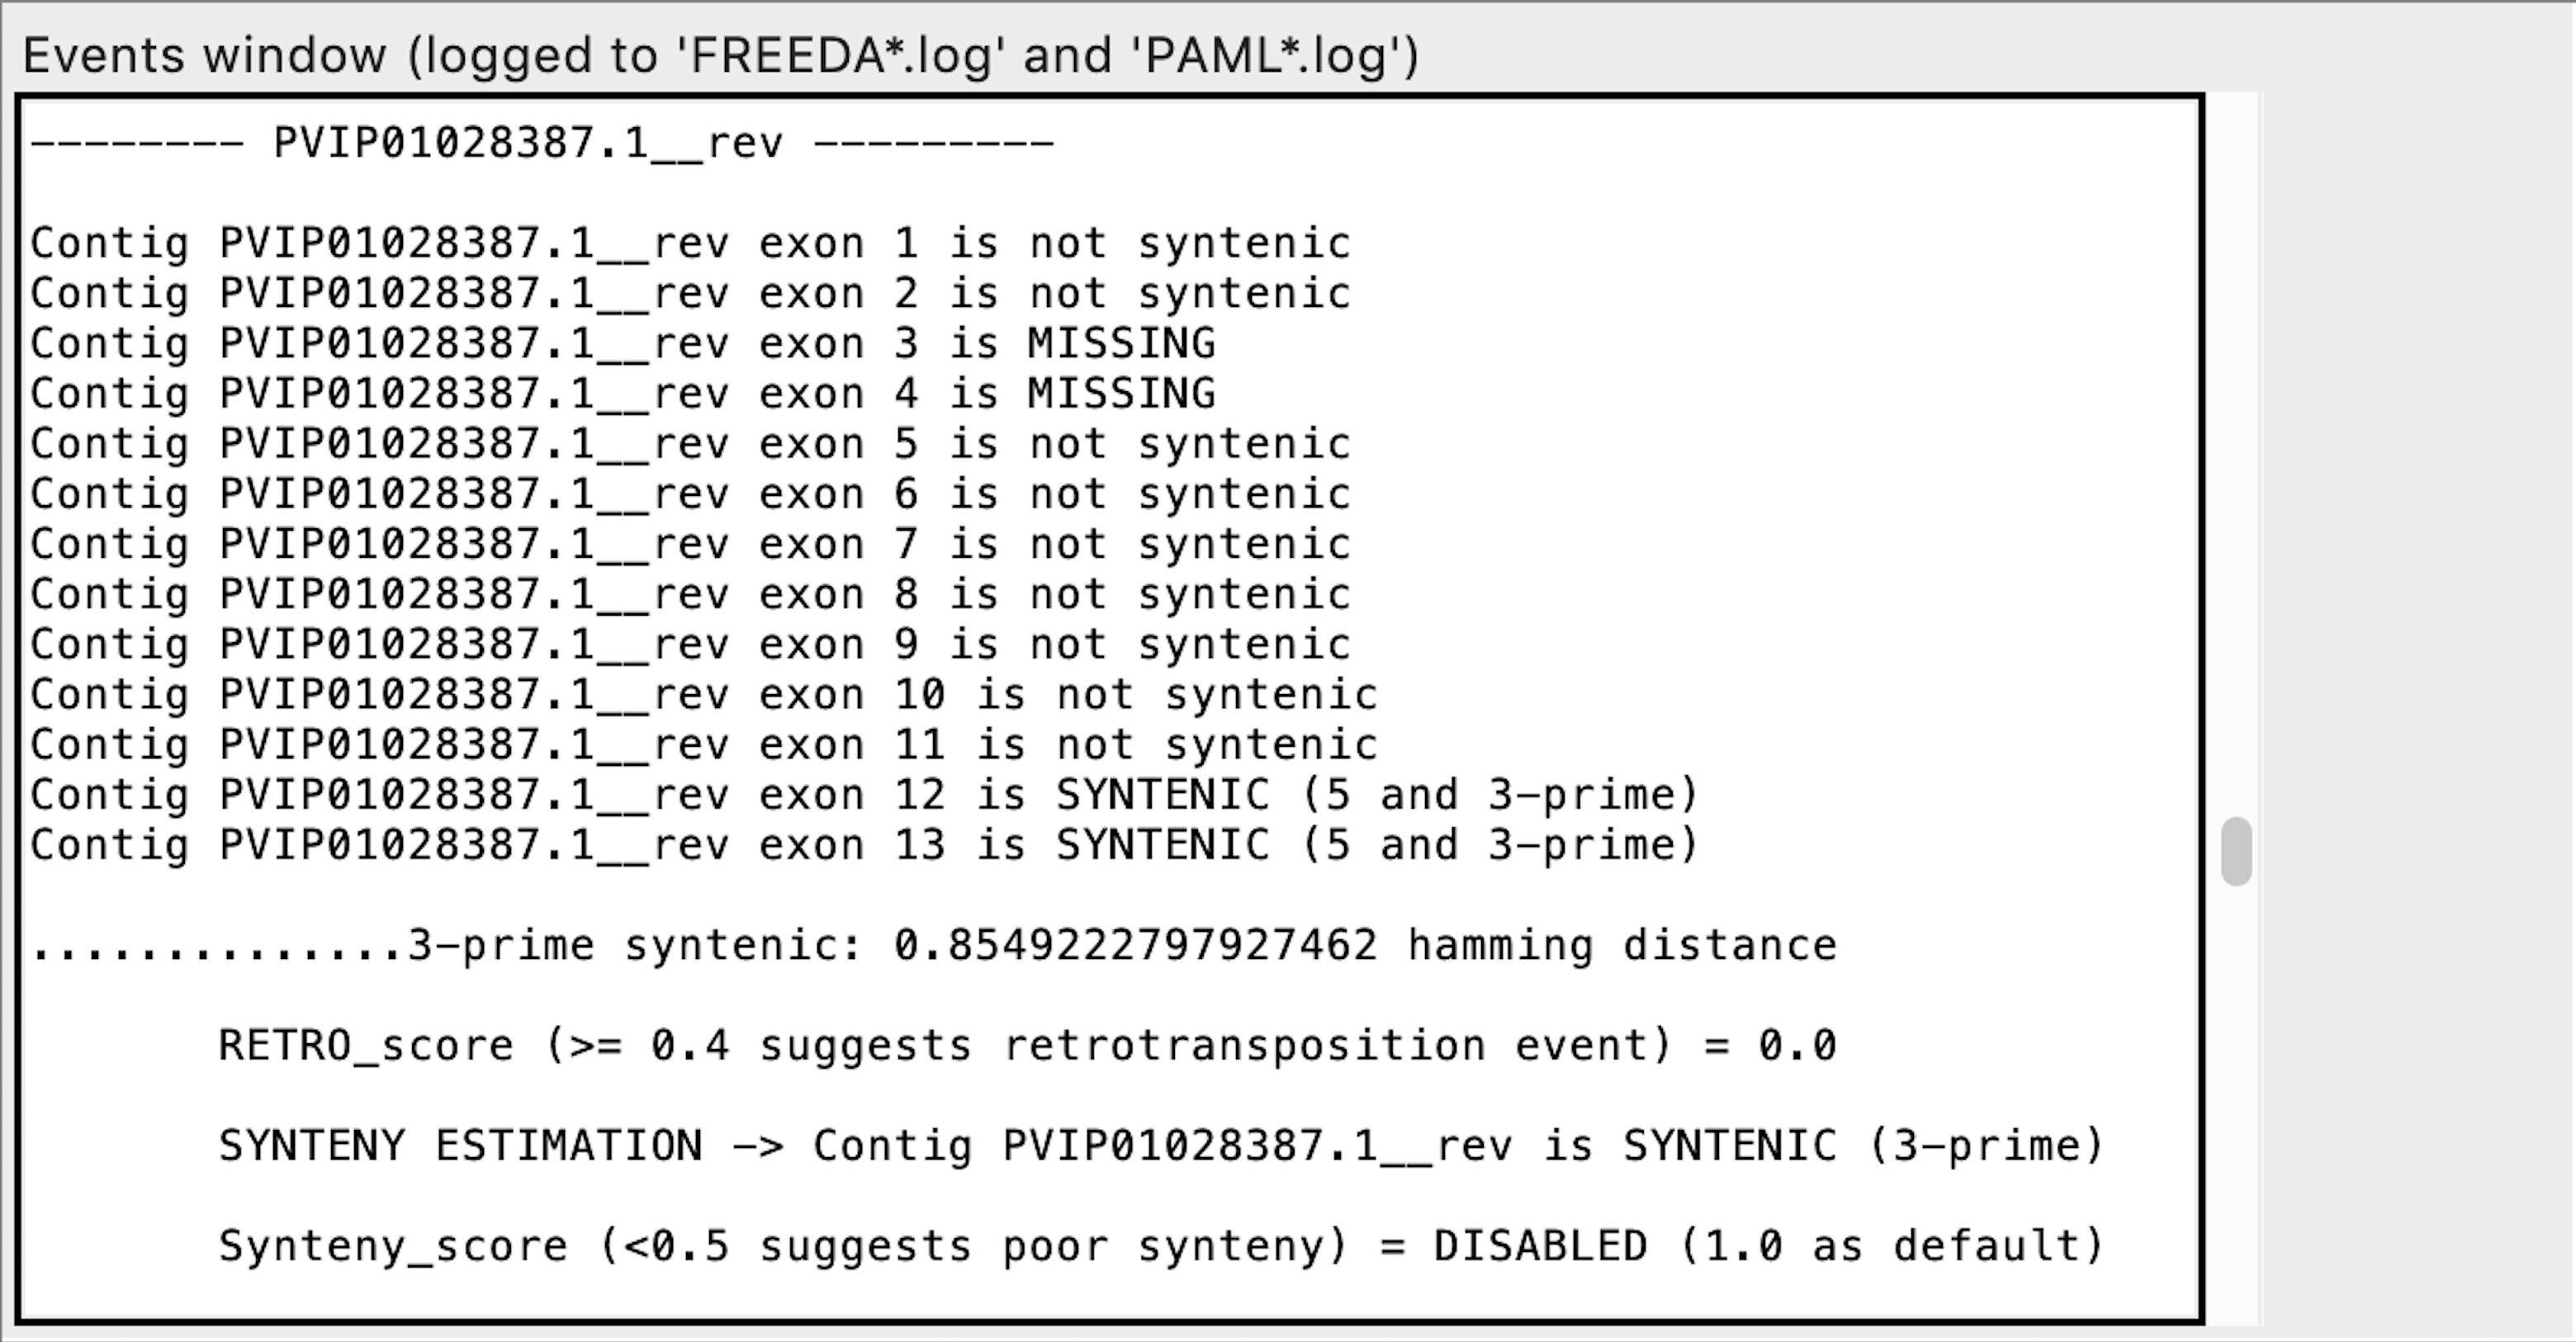
is MISSING means that no chunk of DNA aligned to the expected reference exon (functionally equivalent to non-syntenic exons).*
Resolution of very recent duplications (or heterozygous loci)
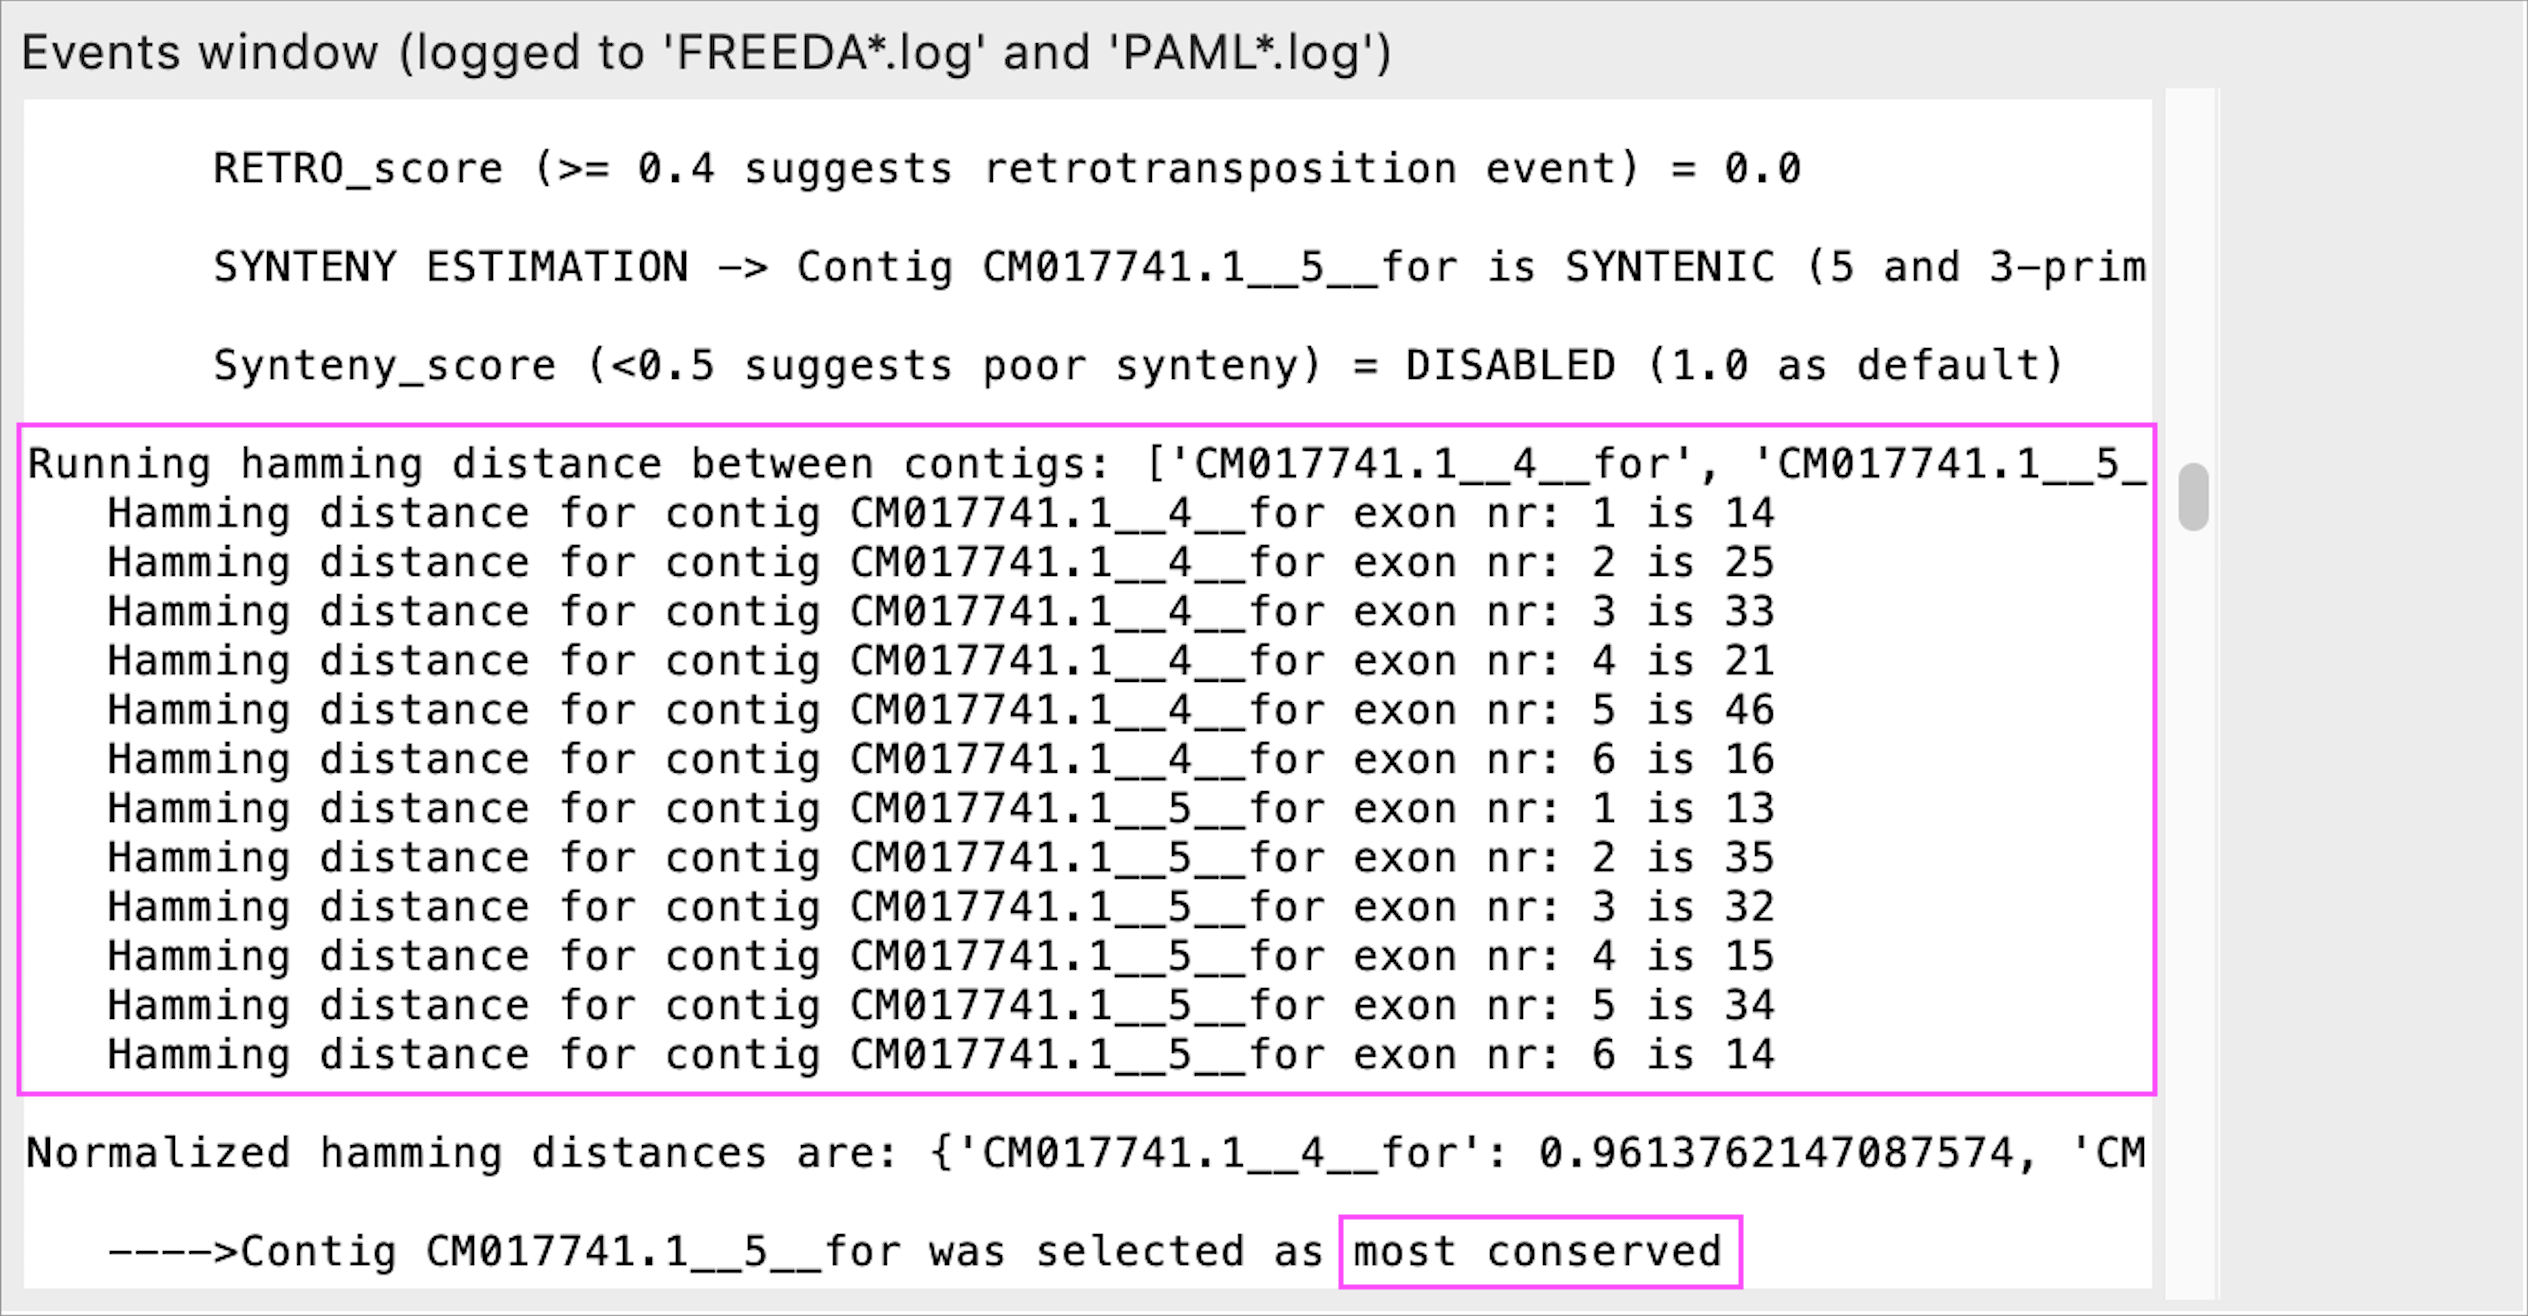
This step is triggered only when at least two contigs bear the same number of likely syntenic exons (e.g. very recent segmental duplications). If the likelihood of synteny is the same - each exon will be compared to the corresponding reference exon using a hamming distance algorithm. The contig with the lowest hamming distance is selected as the most likely orthologous locus (most conserved).
While "Duplication expected" advanced option is not needed to trigger this step, observing such comparison within the "Events window" suggests recent duplications and rerunning the analysis with "Duplication expected" option is advised.
Validating single syntenic exons cloned from selected contigs
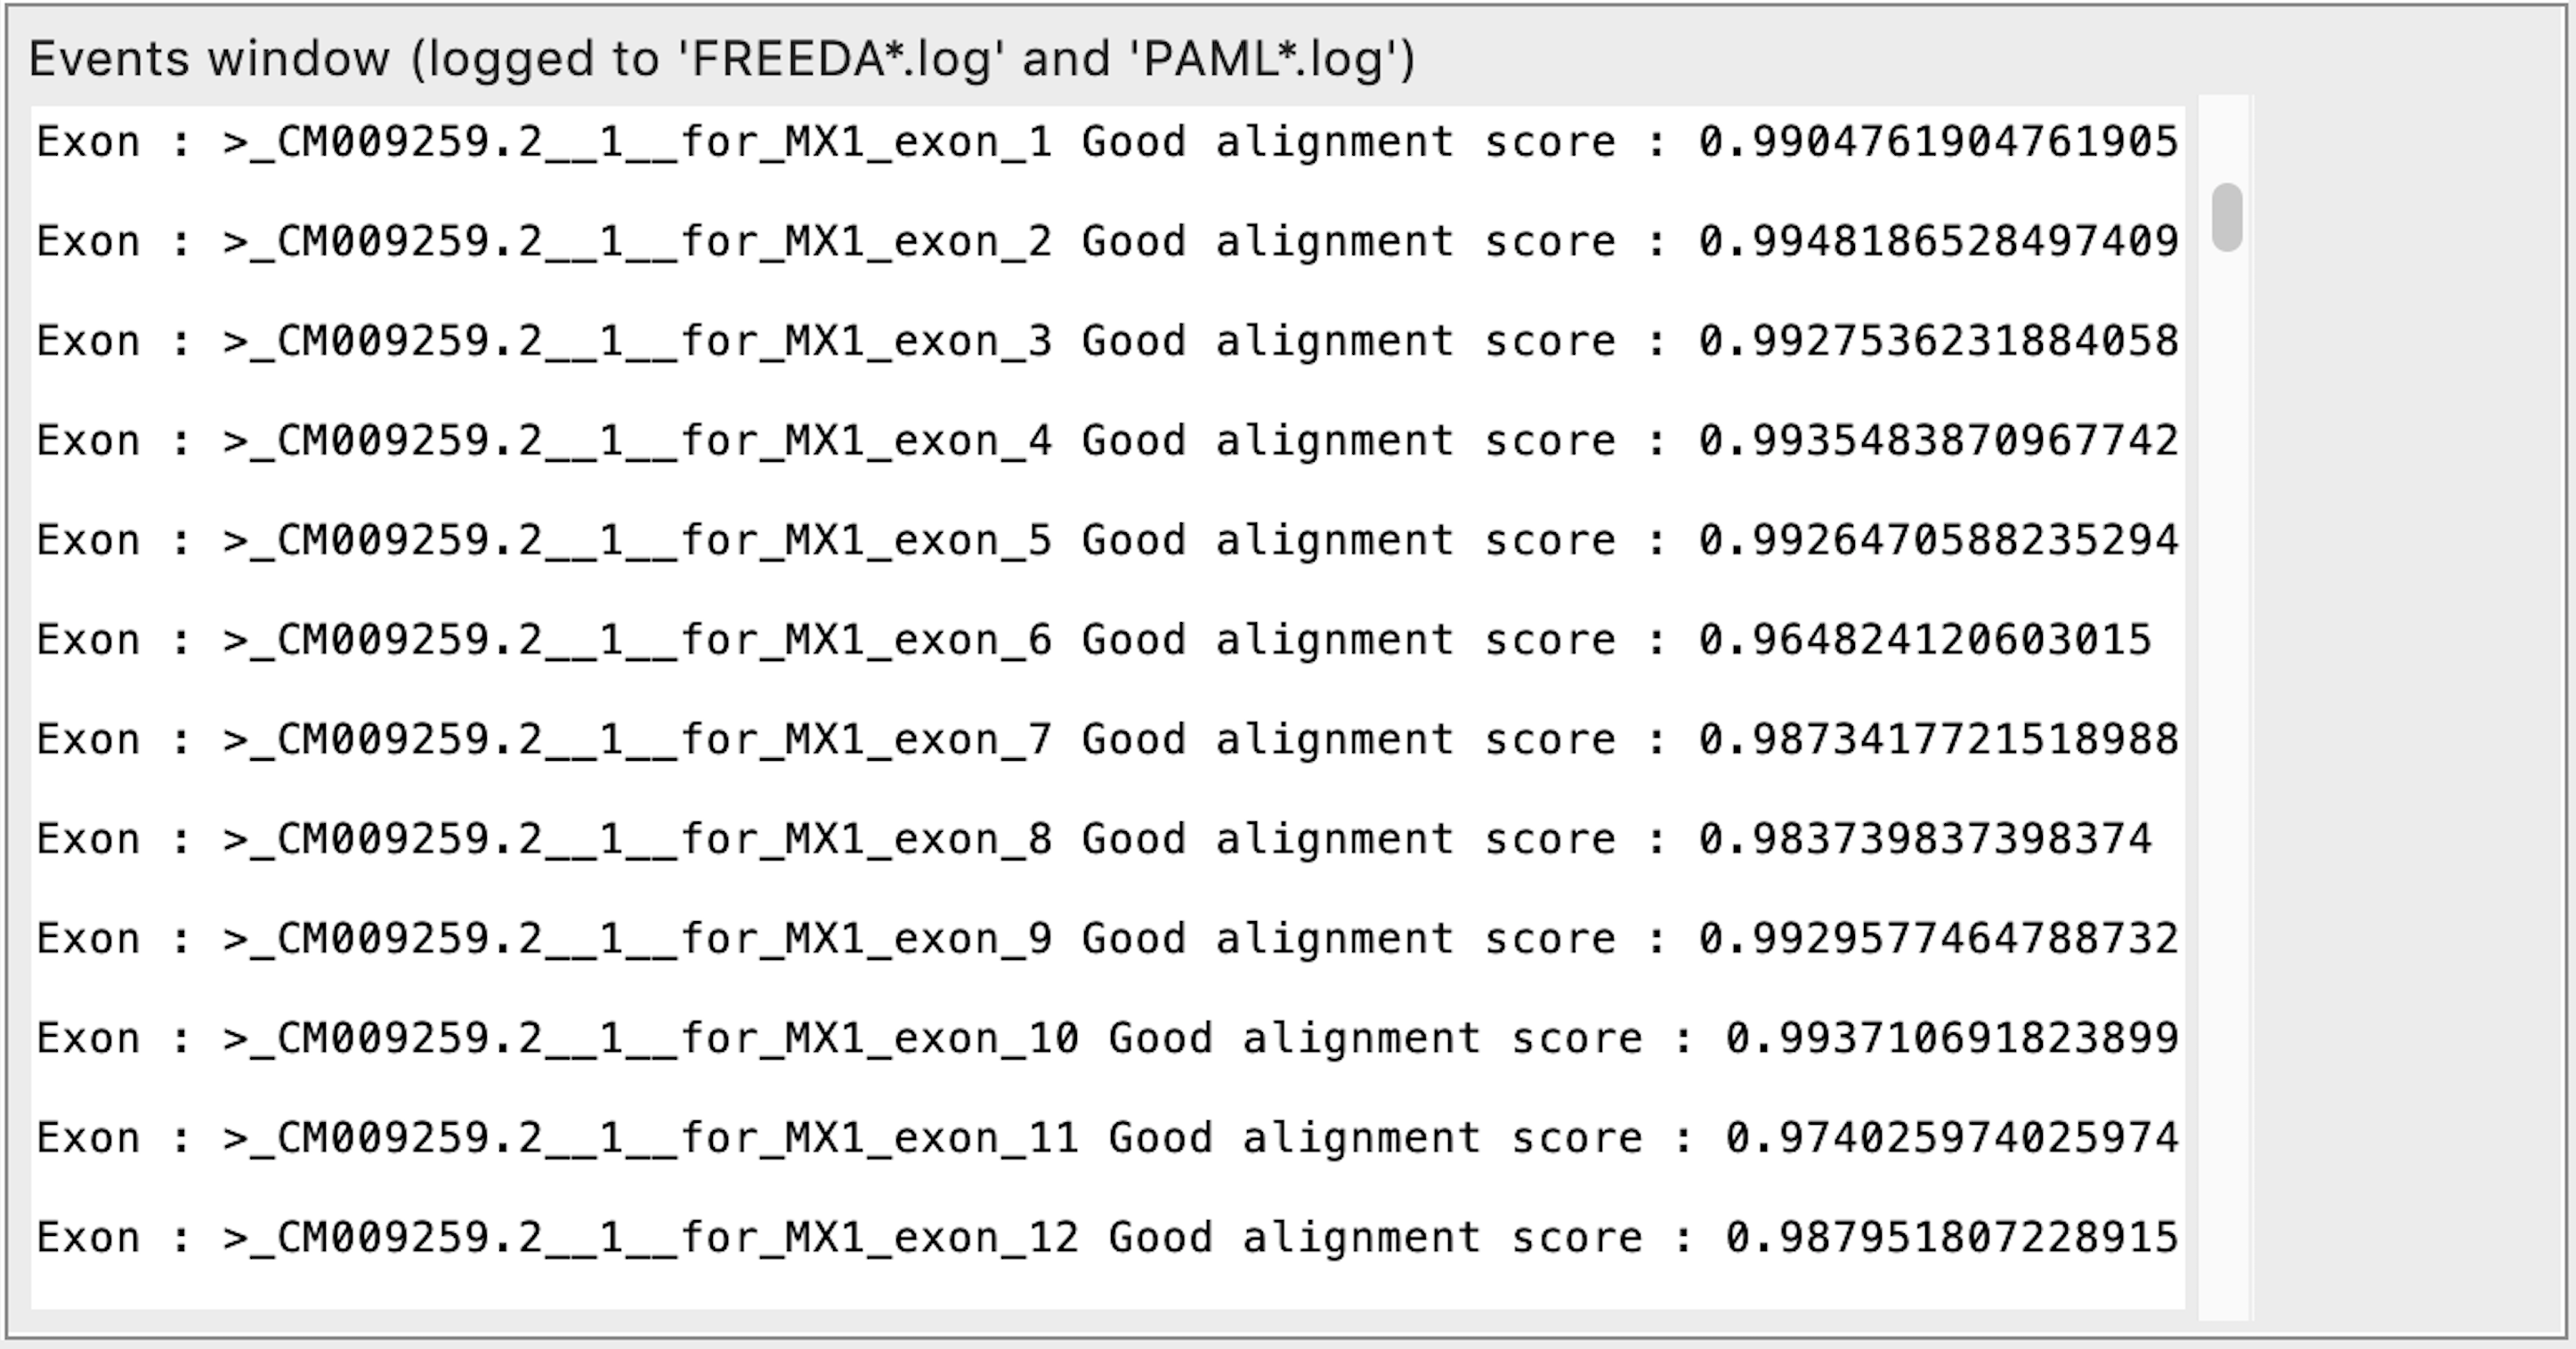
Additional checks (hamming distance as compared to the reference exon) are performed for each syntenic exon from a selected orthologus contig to ensure preservation of intron-exon bounderies. If exon alignment score is <0.75 this suggests either a misalignment or high divergence of the exon. In that case the flanking introns are analyzed (hamming distance to the reference introns) and if synteny is confirmed at BOTH 5 and 3 prime ends (alignment of >0.75) it is unlikely a misalignment but rather exon's divergence - exon is accepted. If the exon alignment score is <0.60 that suggests a misalignment and such exon is rejected (its bases will be masked) without checking introns.
Detecting positive selection
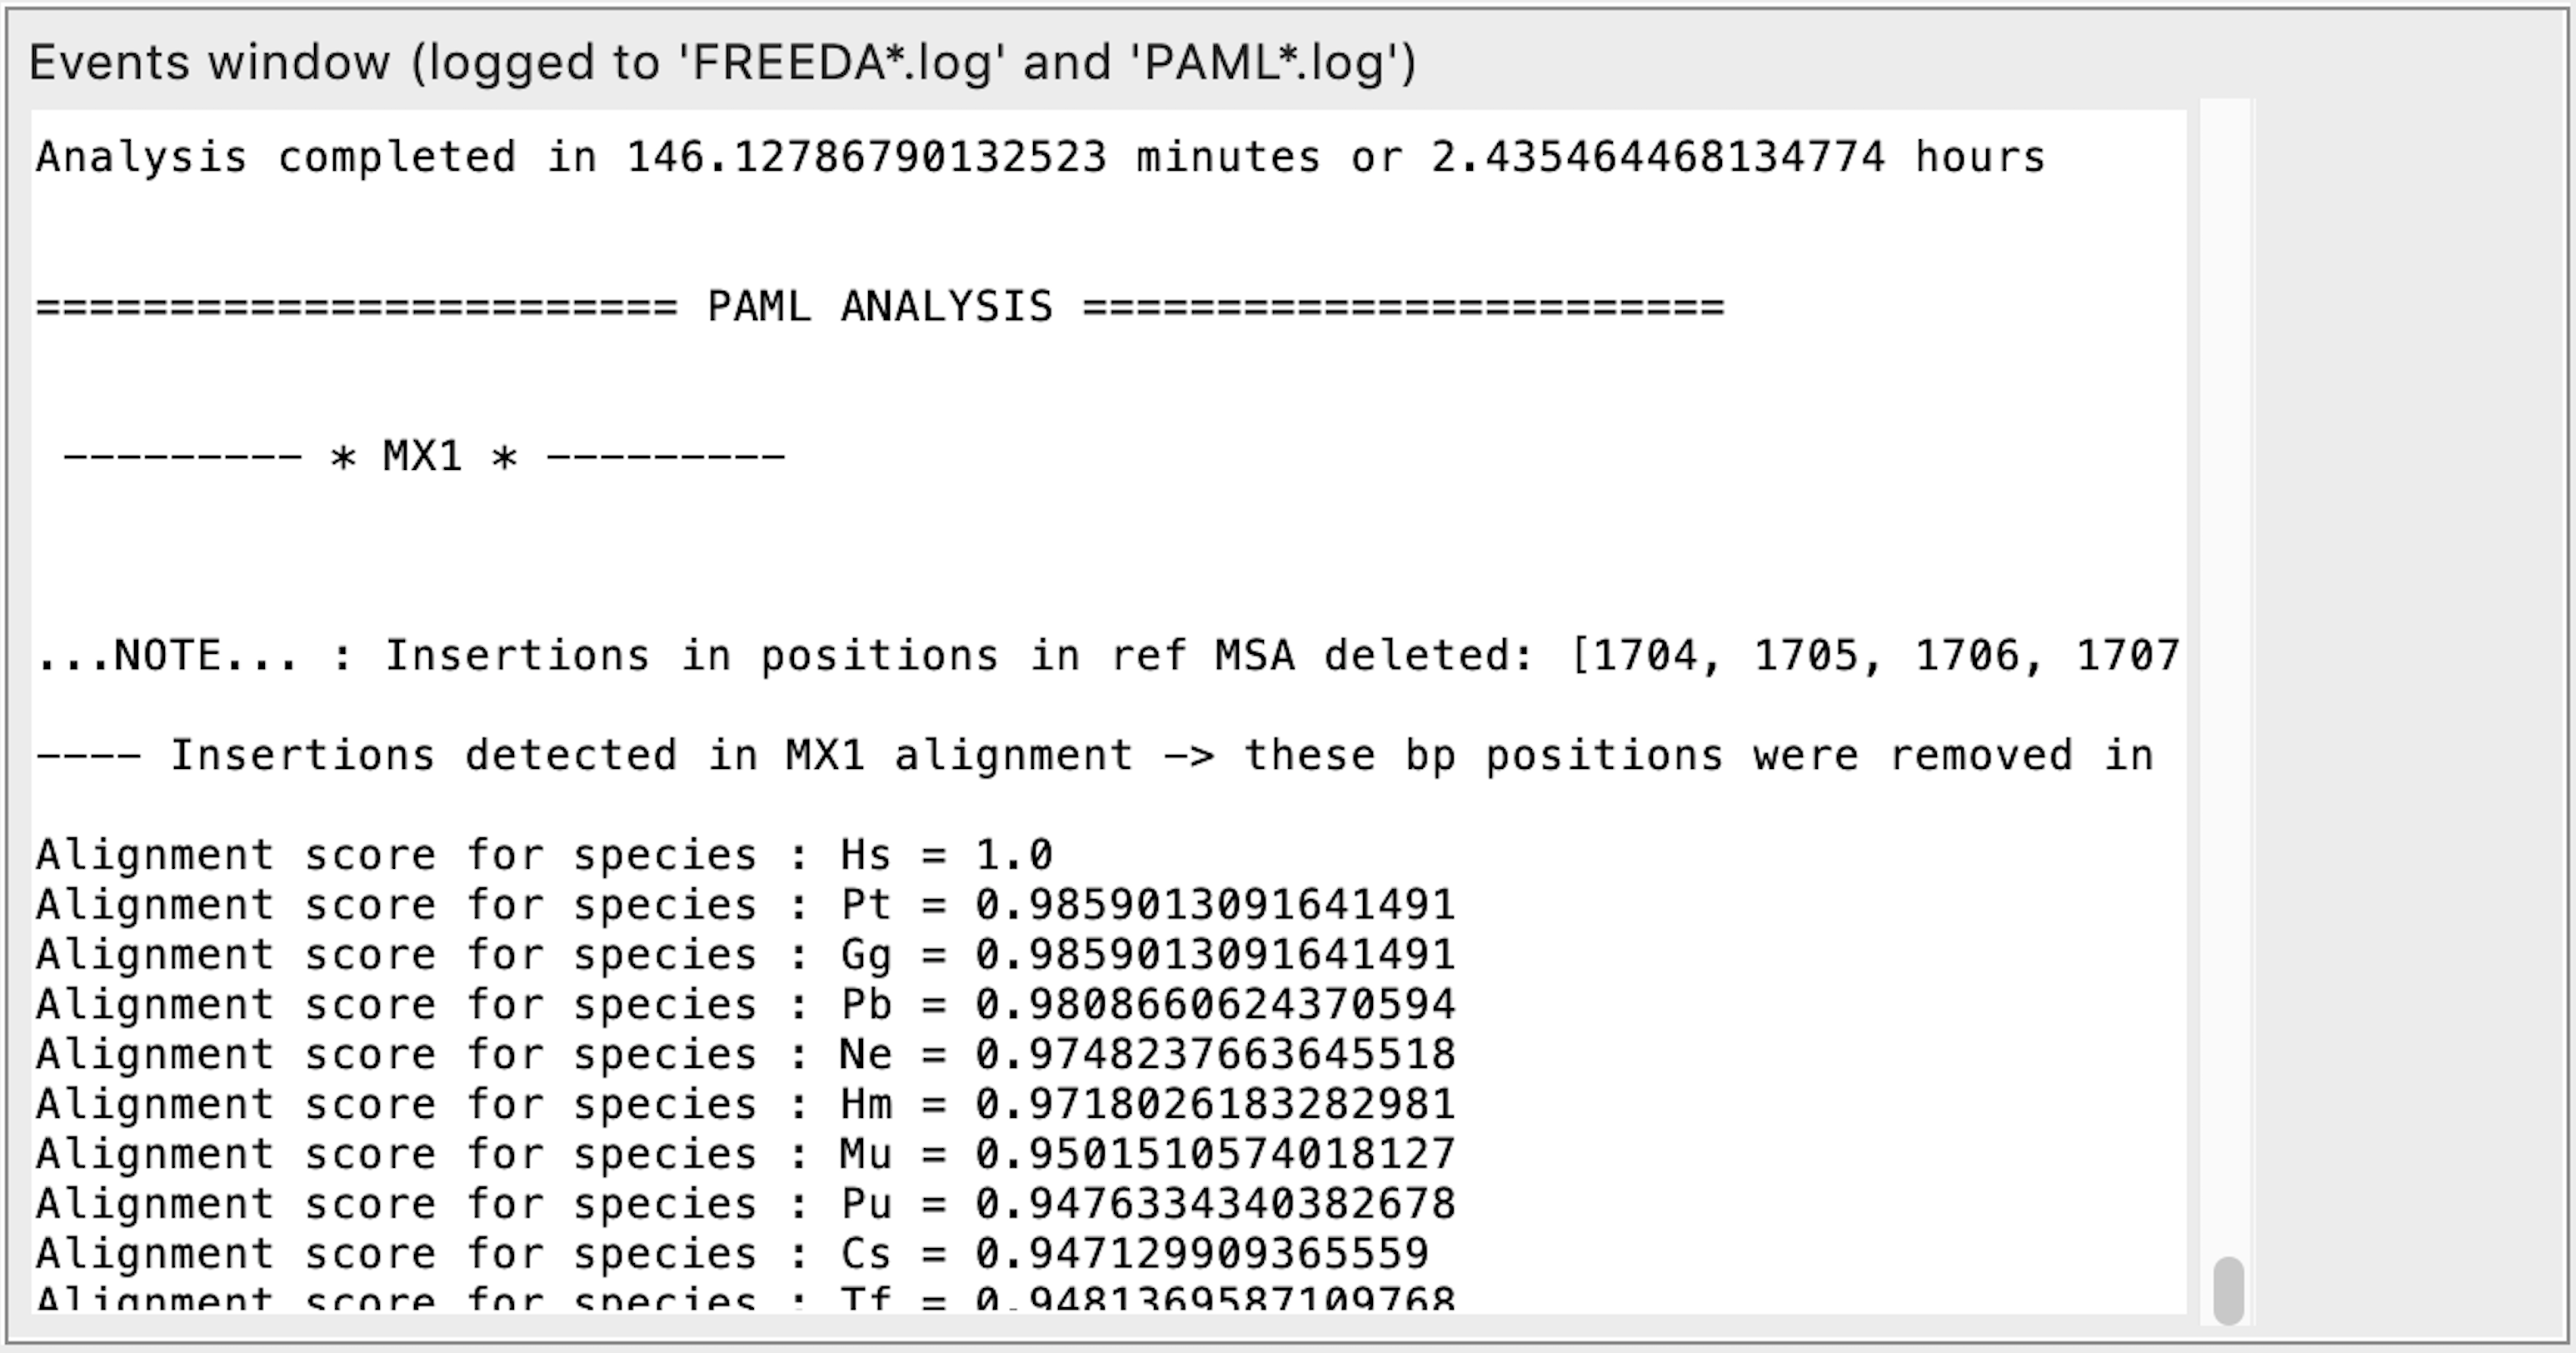
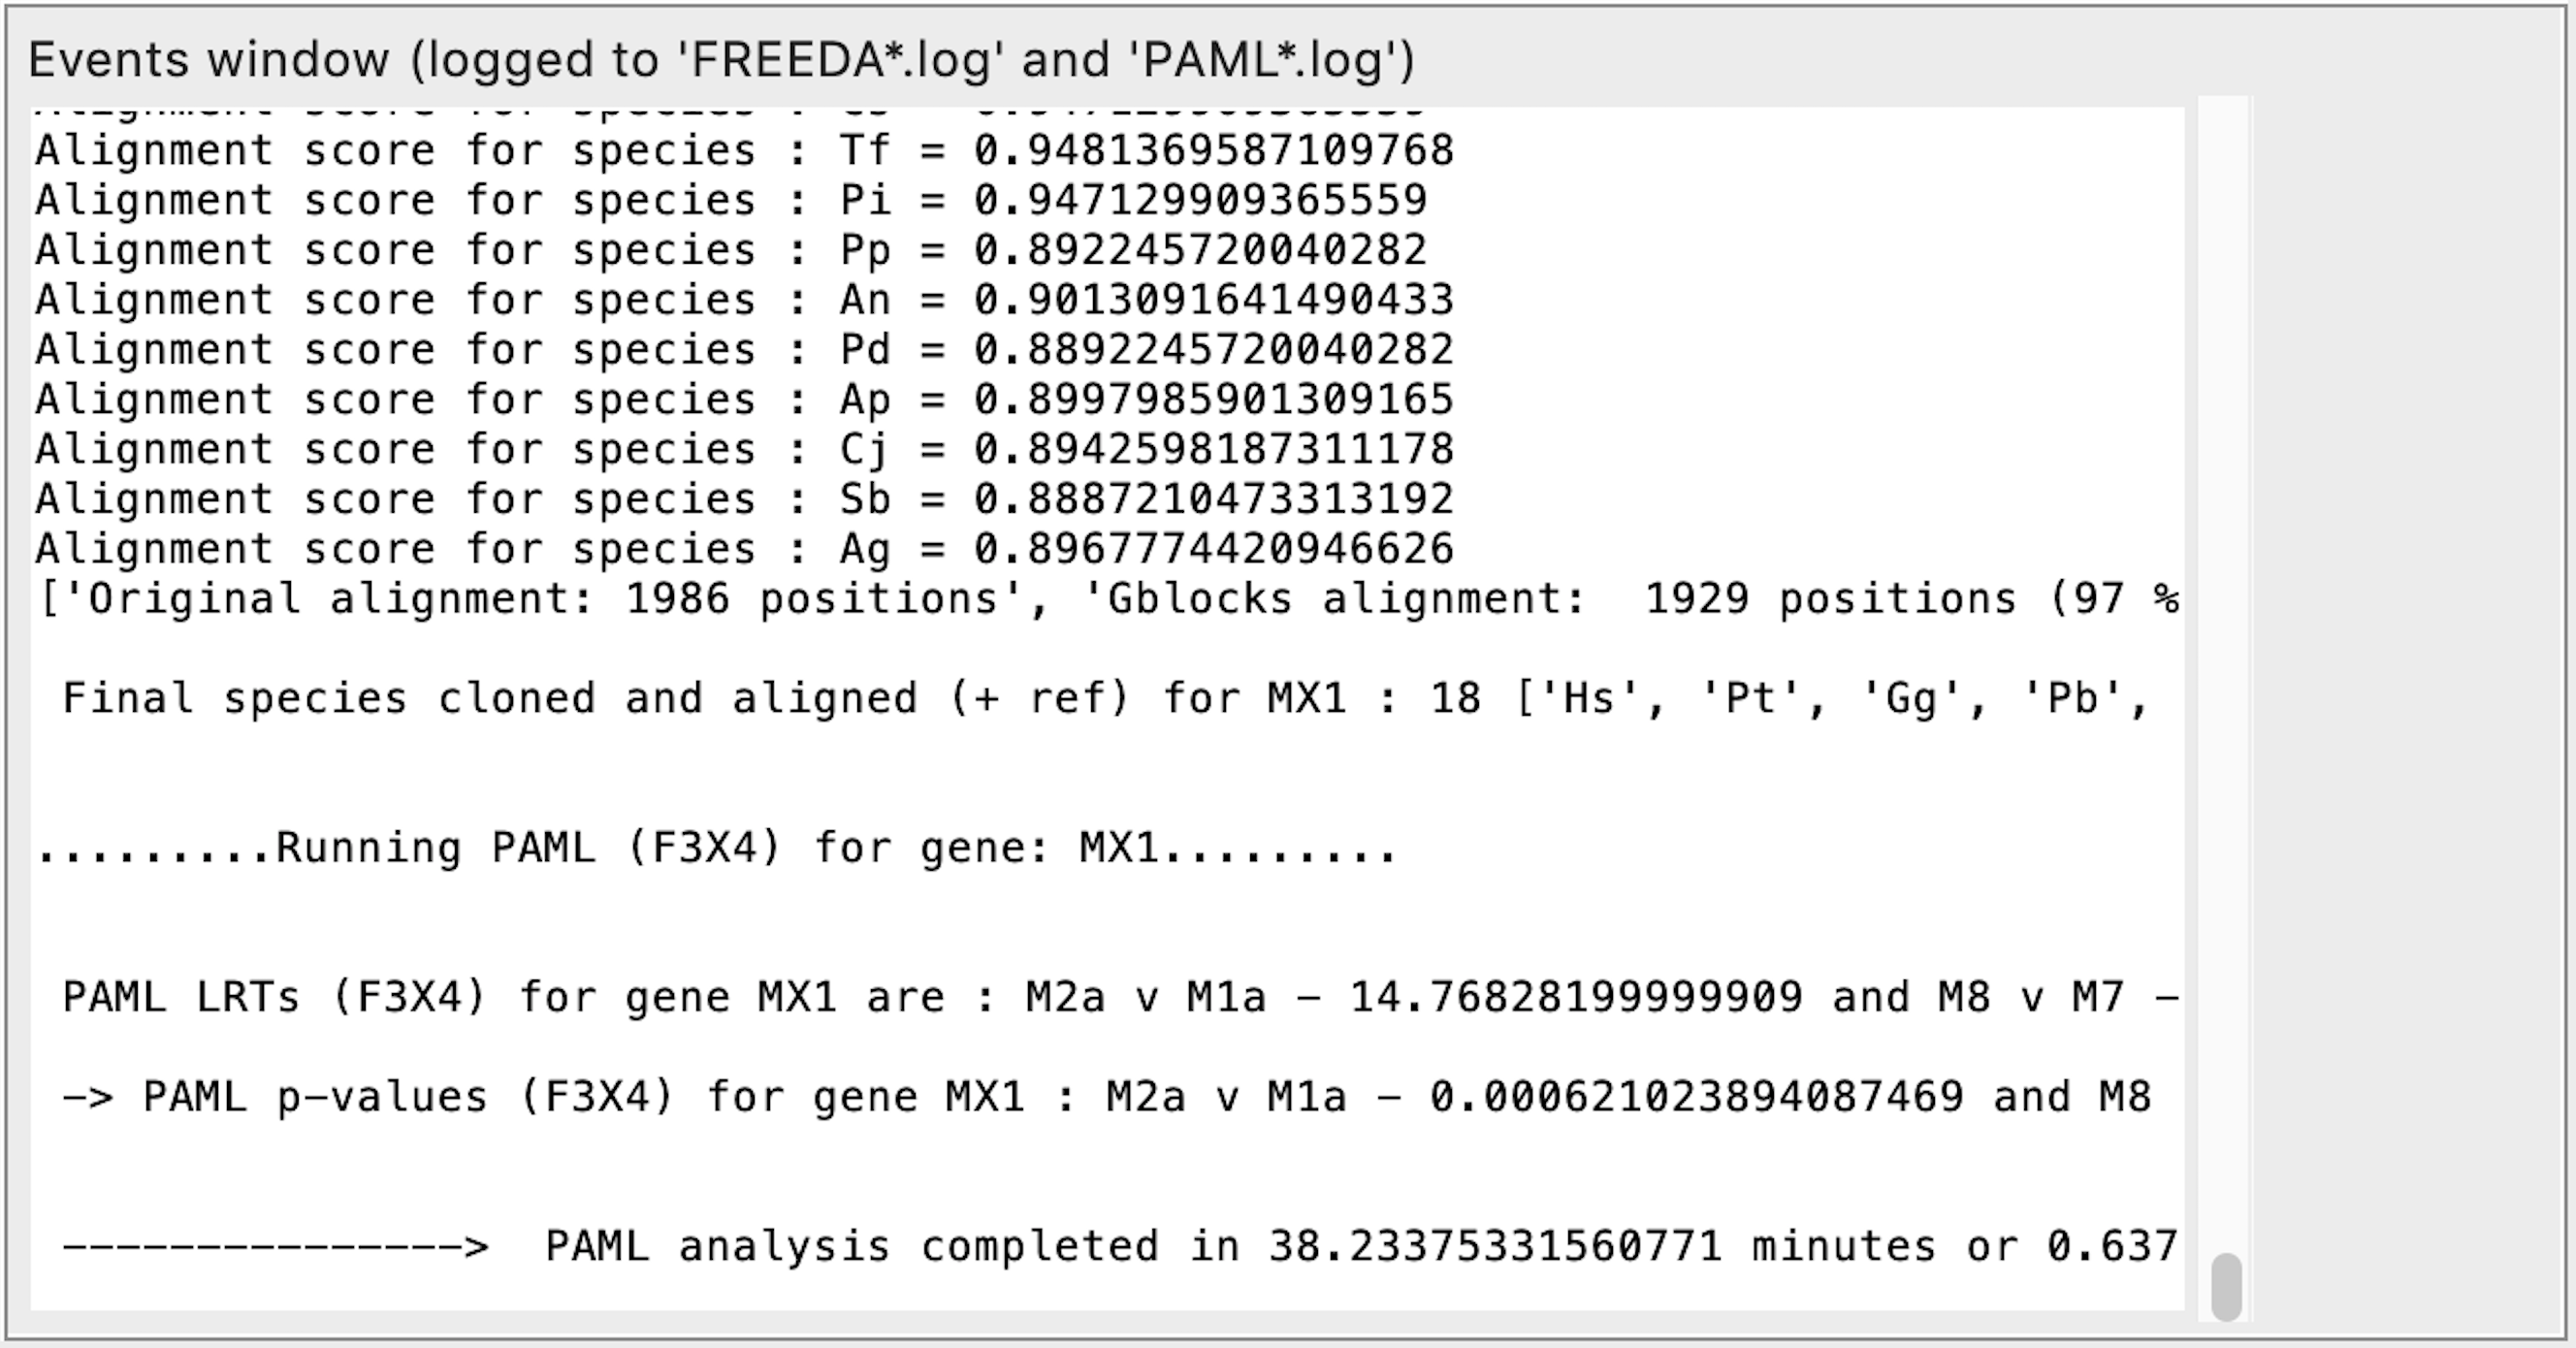
Analysis completed - time it took to find orthologous exons for all analyzed genes. Final multiple sequence alignment is then made for the first gene. Coding sequences with Alignment score <0.69 are eliminated as either containing frameshifts or missing too many exons. Phylogenetic tree for the gene is made based on the nucleotide alignment. PAML analysis starts for the first gene.
Understanding Results
Quick look up table within the GUI
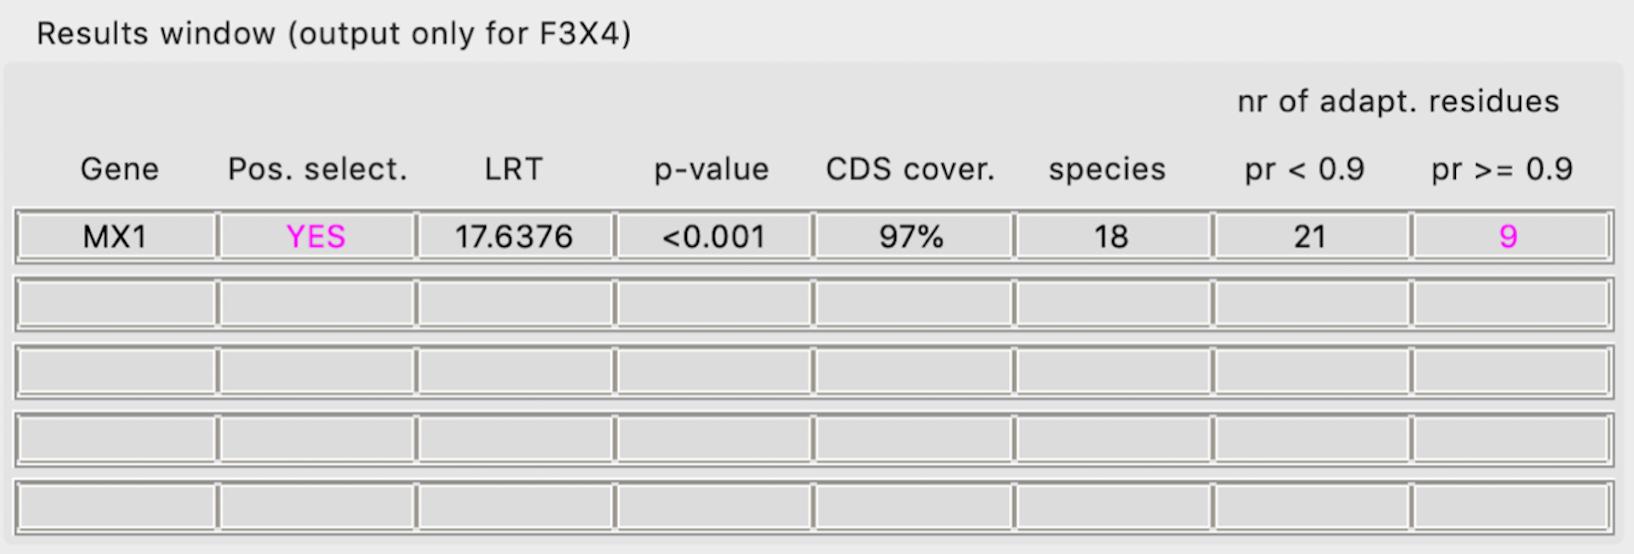
Gene - Gene name provided
- Pos. select. - Is there evidence of positive selection acting on the gene?
YES - evidence of positive selection using both M7 vs M8 and M1a vs M2a (more conserved) model comparison
(YES) - evidence of positive selection using M7 vs M8 but not M1a vs M2a (more conserved) model comparison
NO - no evidence of positive selection
LRT - Likelihood Ratio Test that determines statistical support for evidence of positive selection (>5.99 -> p=0.05)
p-value - Directly linked to the LRT value
CDS cover. - Percentage of codons analyzed as compared to the reference coding sequence (microexons are excluded from this calculation)
species - Number of species (orthologues) analyzed. Less than 6 species may yield unreliable results
pr < 0.9 - Number of all residues that might be evolving under positive selection
pr >= 0.9 - Number of residues with high probability of being under positive selection
Folder with all results (inside user-indicated "Set directory")
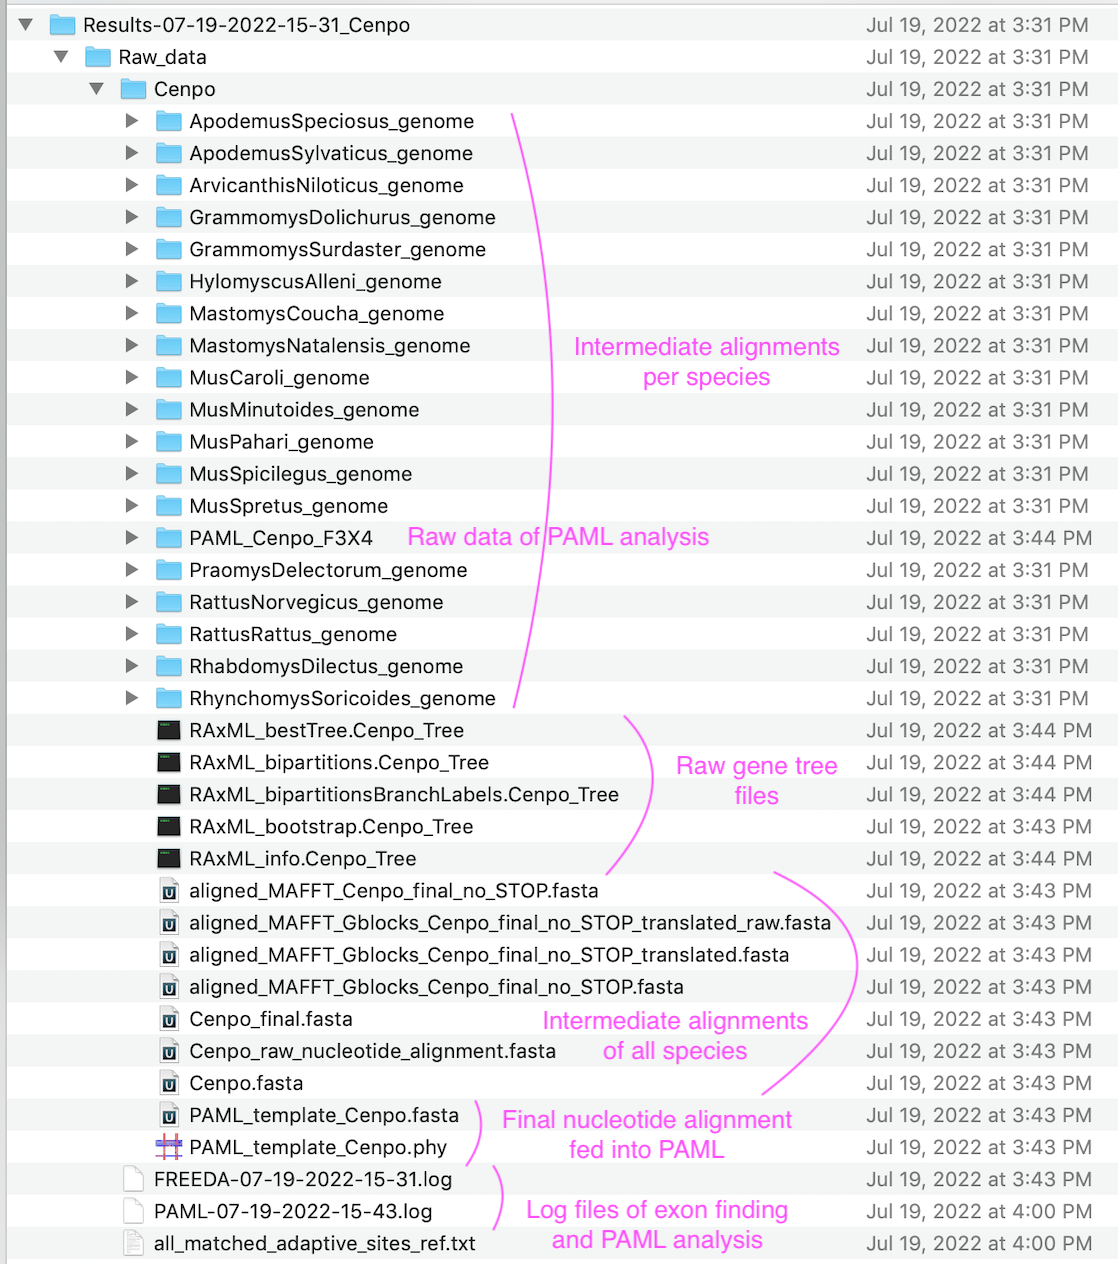
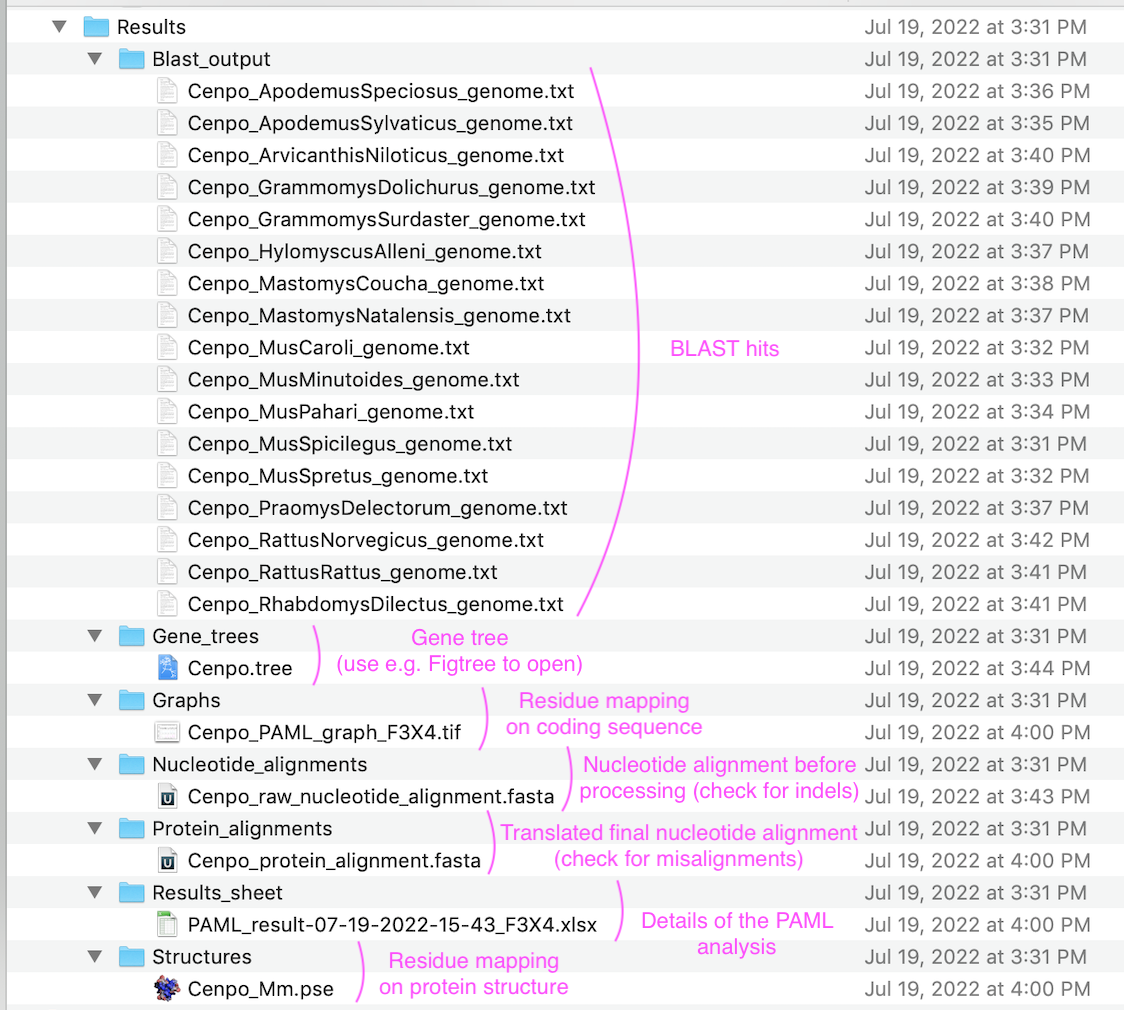
Exemplary nucleotide alignment (viewed in UNIPRO Ugene)
Cenpo_raw_nucleotide_alignment.fasta
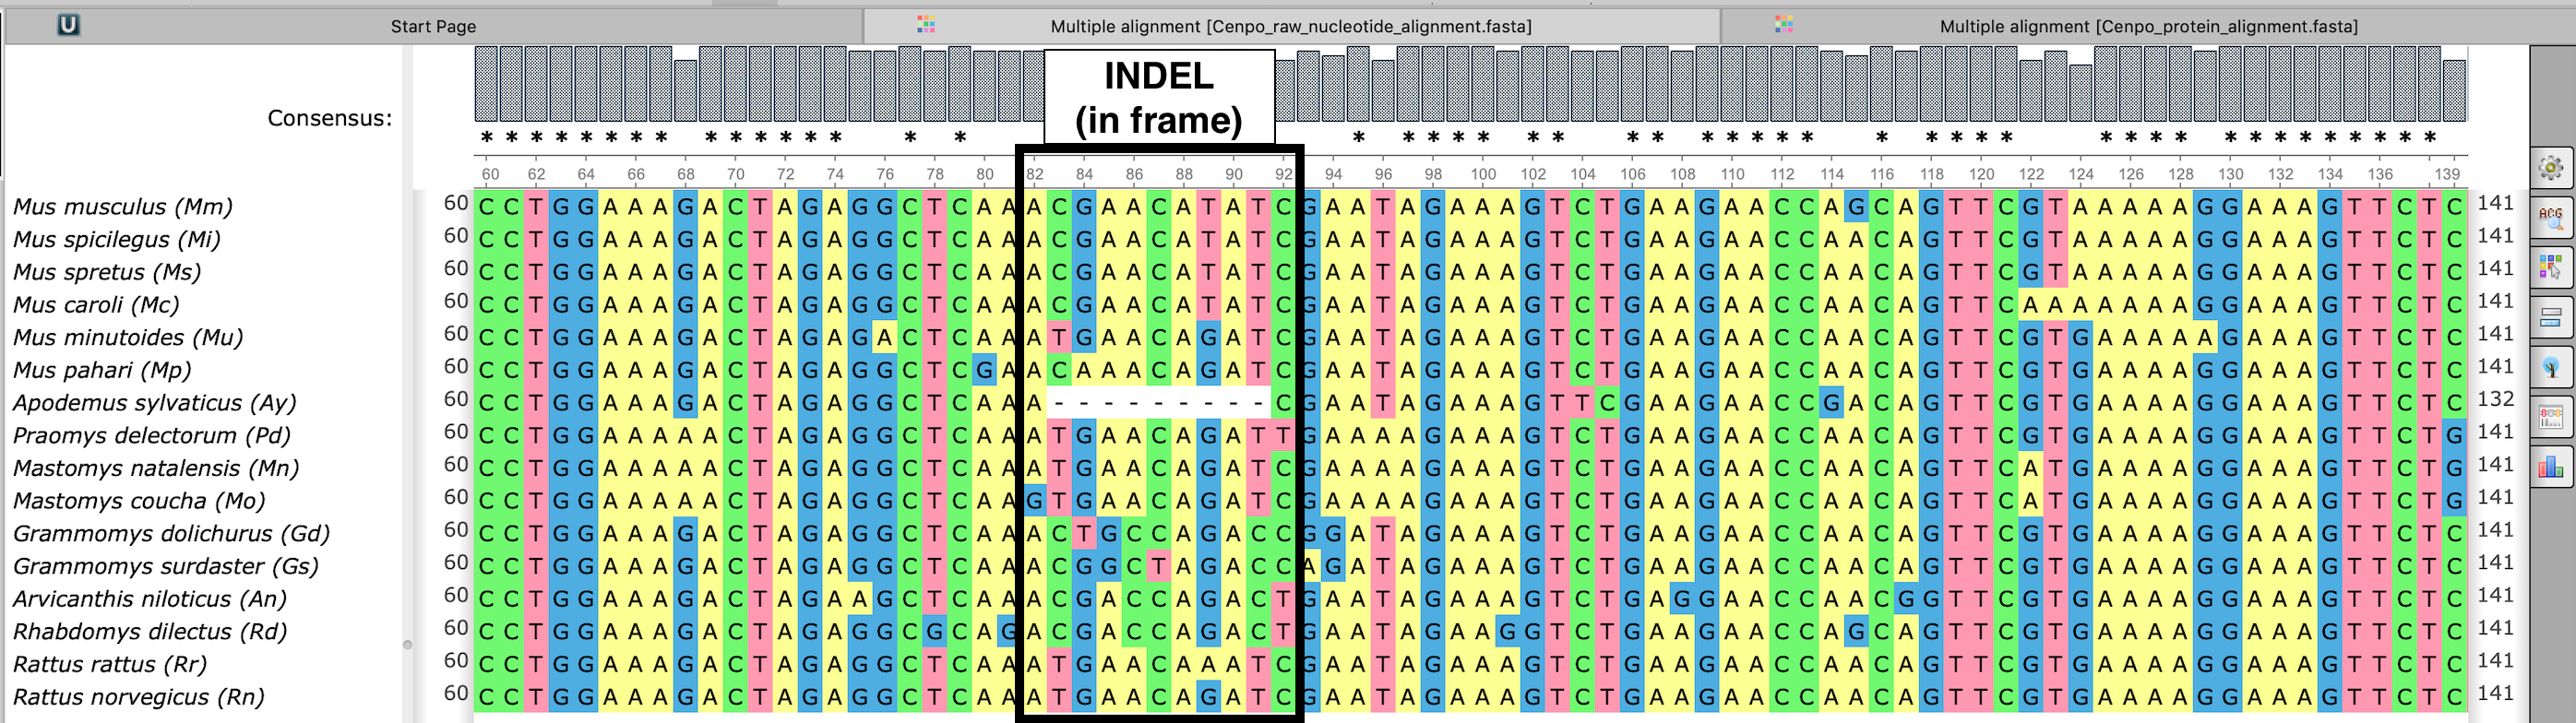
Marked is an indel (likely deletion in Apodemus sylvaticus) before any processing. Region marked will be removed as it cannot be analyzed. Inspect this file to find which species causes loss of regions from final alignment.
Exemplary protein alignment (viewed in UNIPRO Ugene)
Cenpo_protein_alignment.fasta
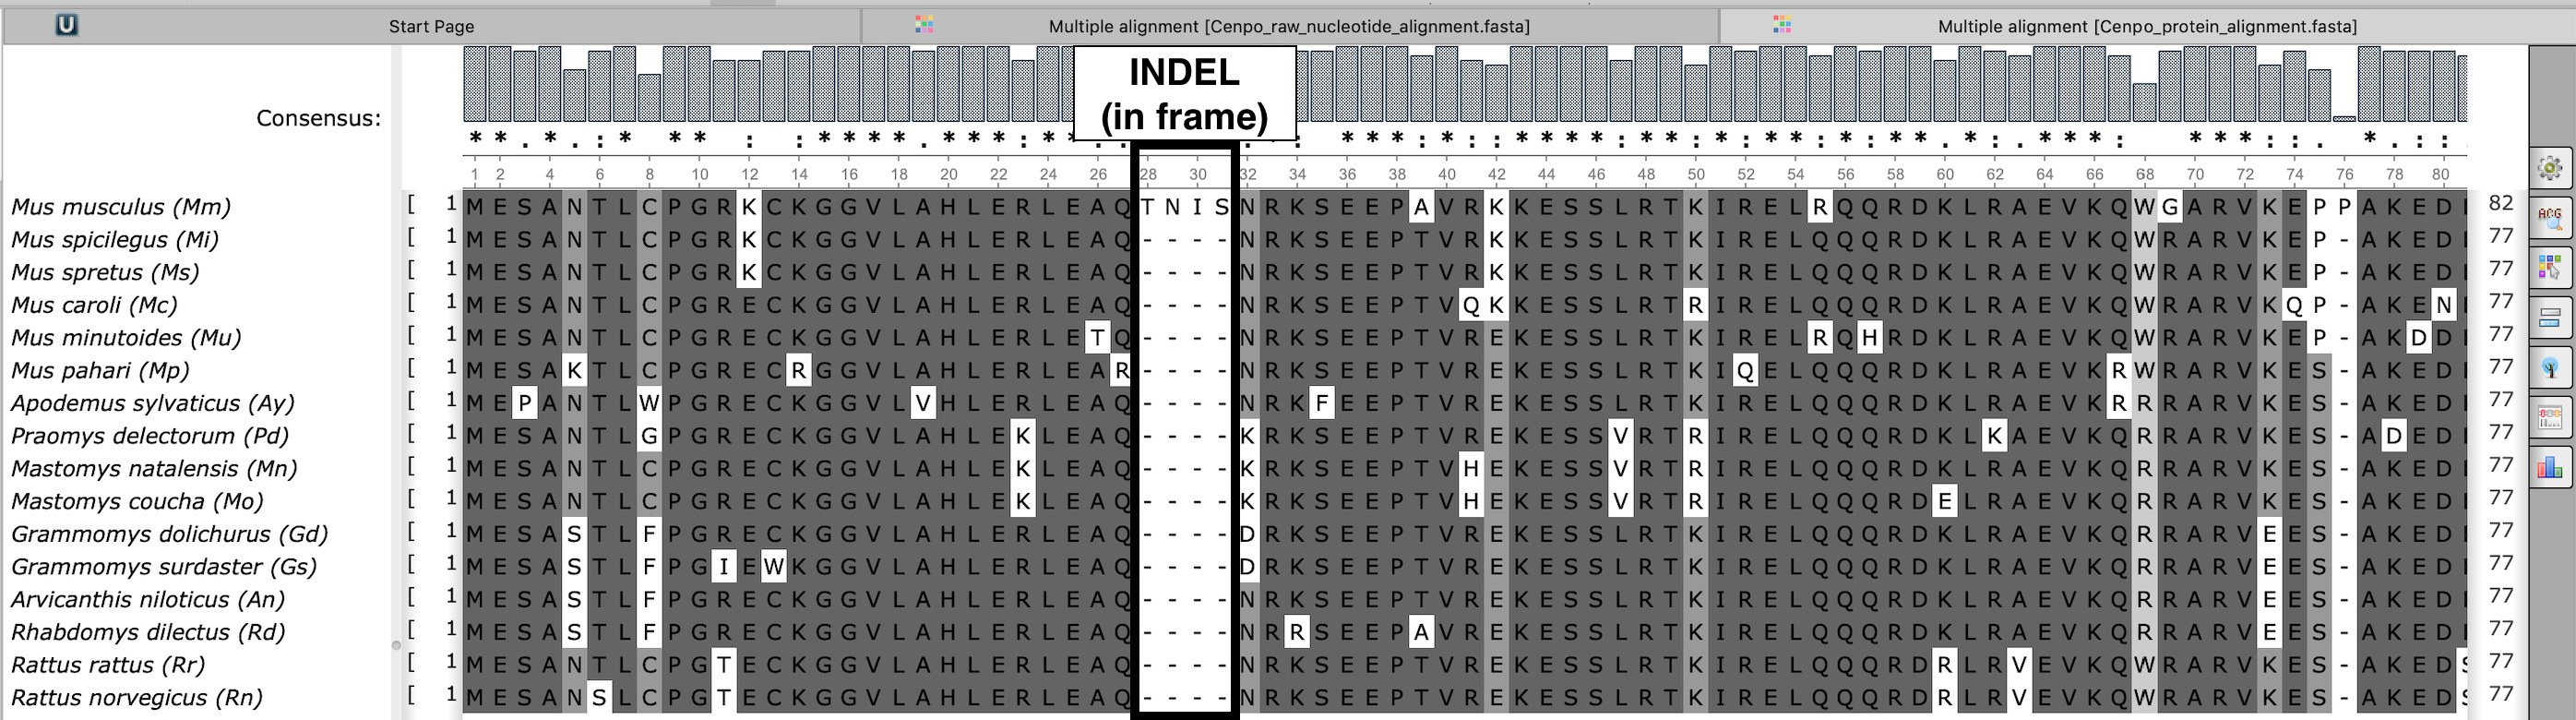
Marked is the same indel (see above) after it has been processed. Although only 9bp are missing, they span 4 codons. Therefore 4 amino acids were removed from each species (including the first species - after the analysis is complete, FREEDA adds back the missing amino acids to show what was removed). Inspect this file for frameshifts. Use abbreviations displayed here to exclude species.
Potential misalignment is visible in the protein sequence alignment
CENPI_protein_alignment.fasta
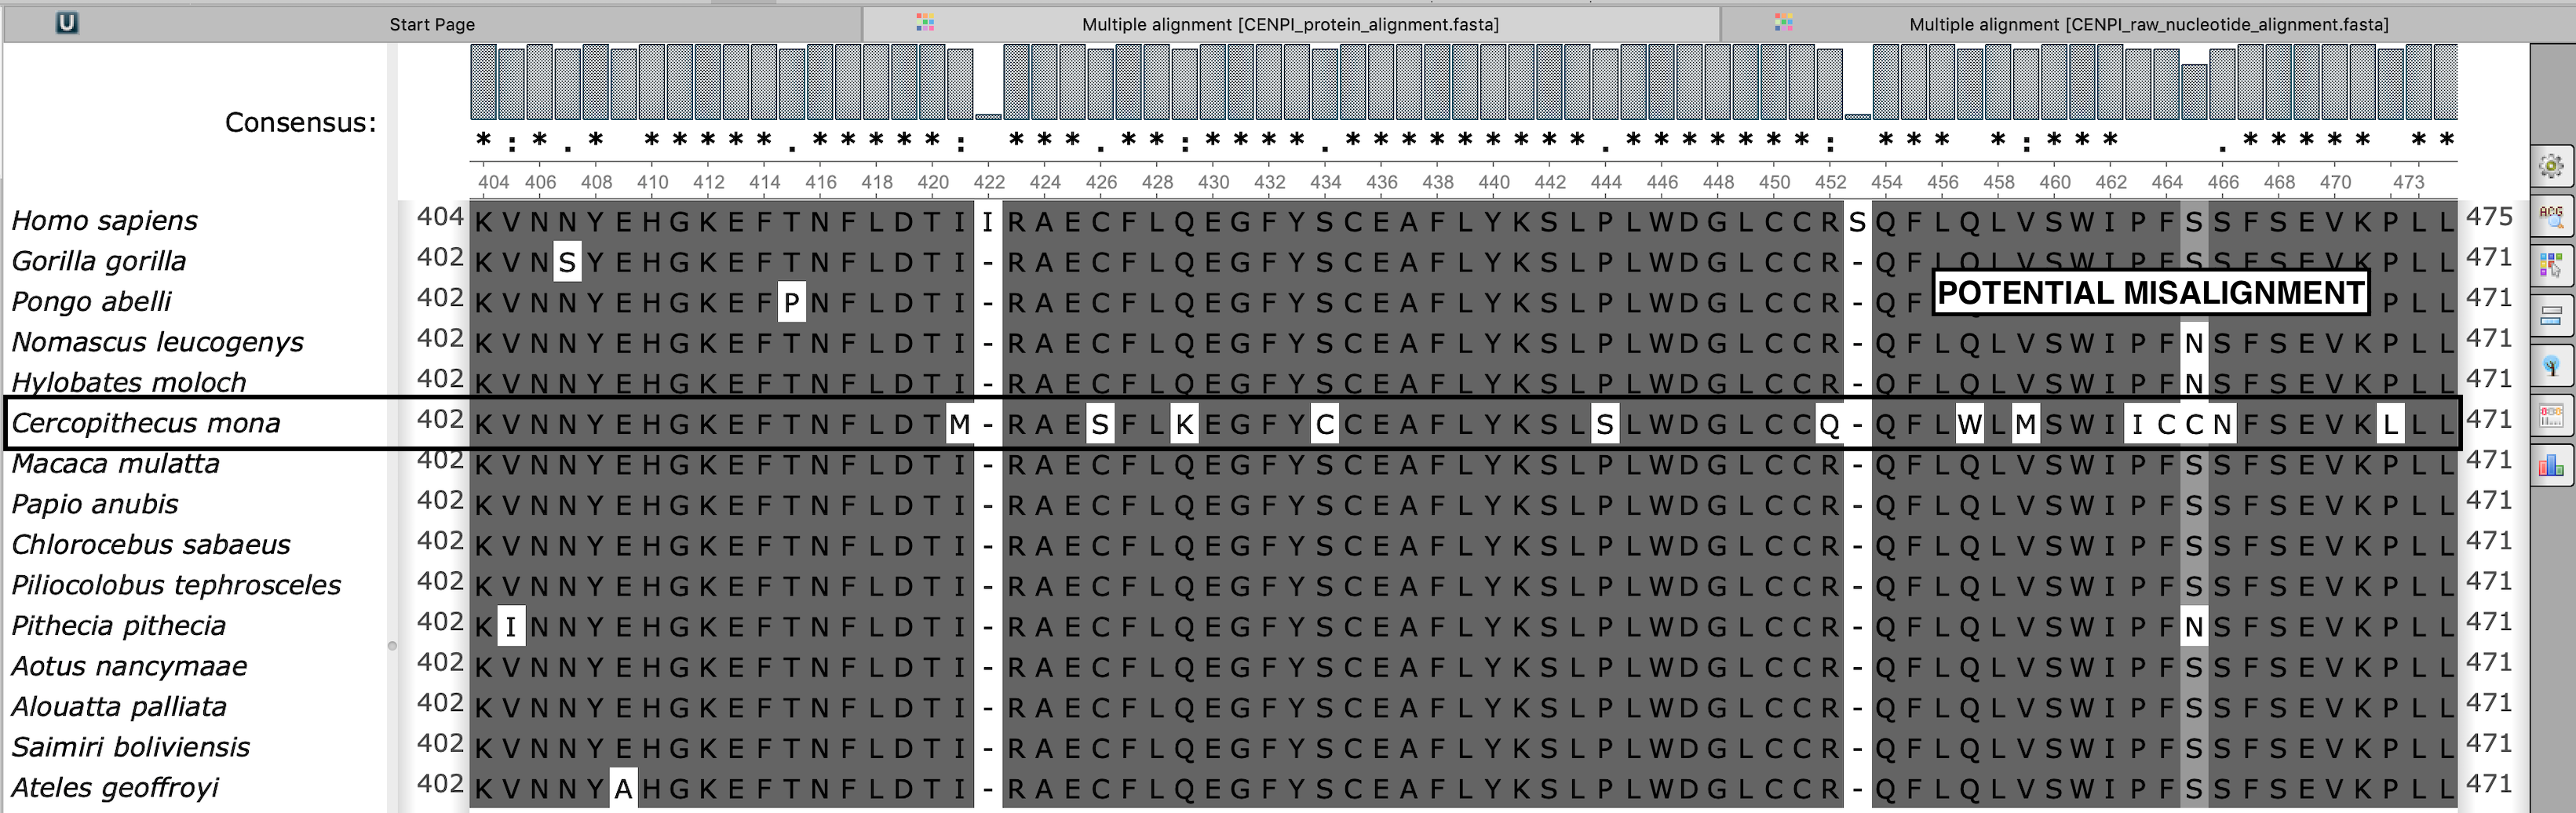
Cercopithecus mona orthologue shows a distinct pattern of non-synonymous substitutions, raising a possibility of misalignment. The user should re-analyze the gene of interest using the "exclude species" option to avoid spurious signatures of positive selection.
Potential misalignment is visible in the raw nucleotide sequence alignment
CENPI_raw_nucleotide_alignment.fasta
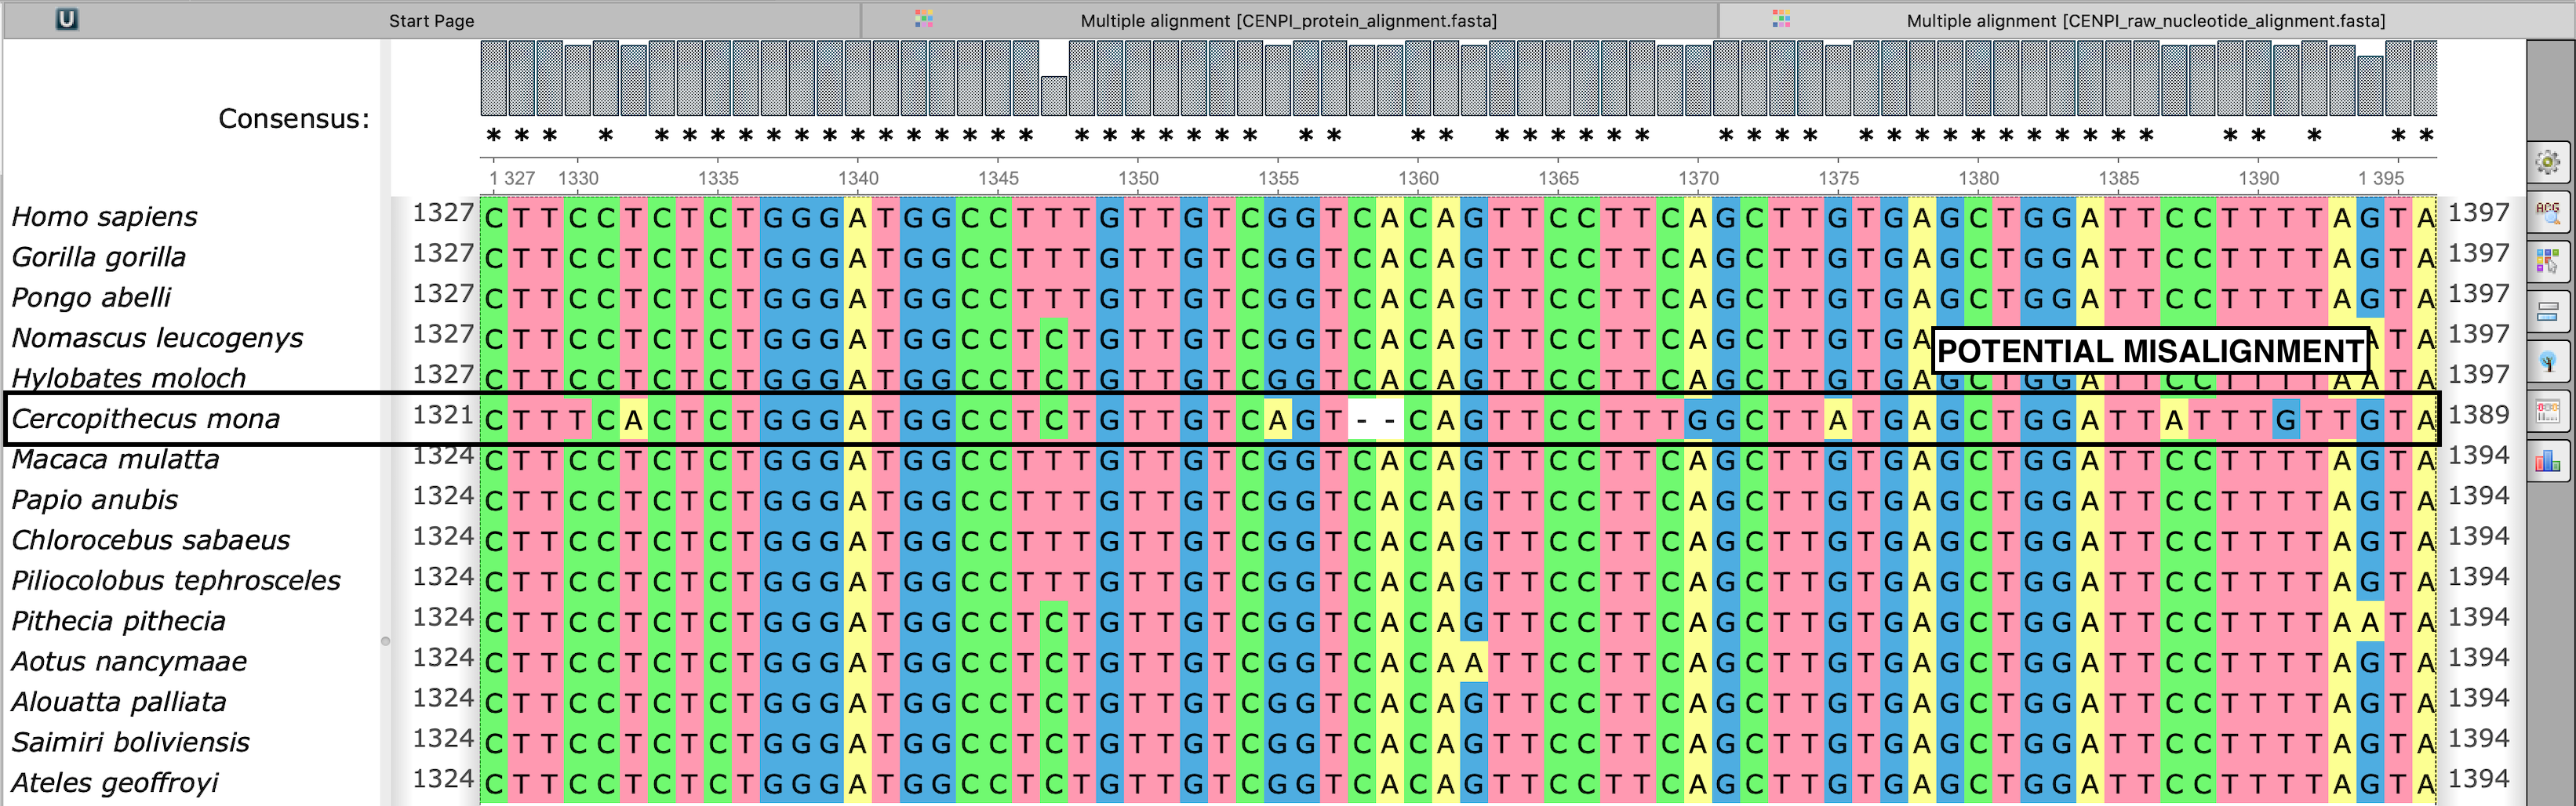
Cercopithecus mona orthologue shows an unusual out-of-frame 2bp deletion in the middle of the sequence, possibly due to a sequencing error. While FREEDA alignment filtering is robust in preventing a global protein misalignment, a local misalignment can still occur as seen in the protein sequence (see above). The user should re-analyze the gene of interest using the "exclude species" option to avoid spurious signatures of positive selection.
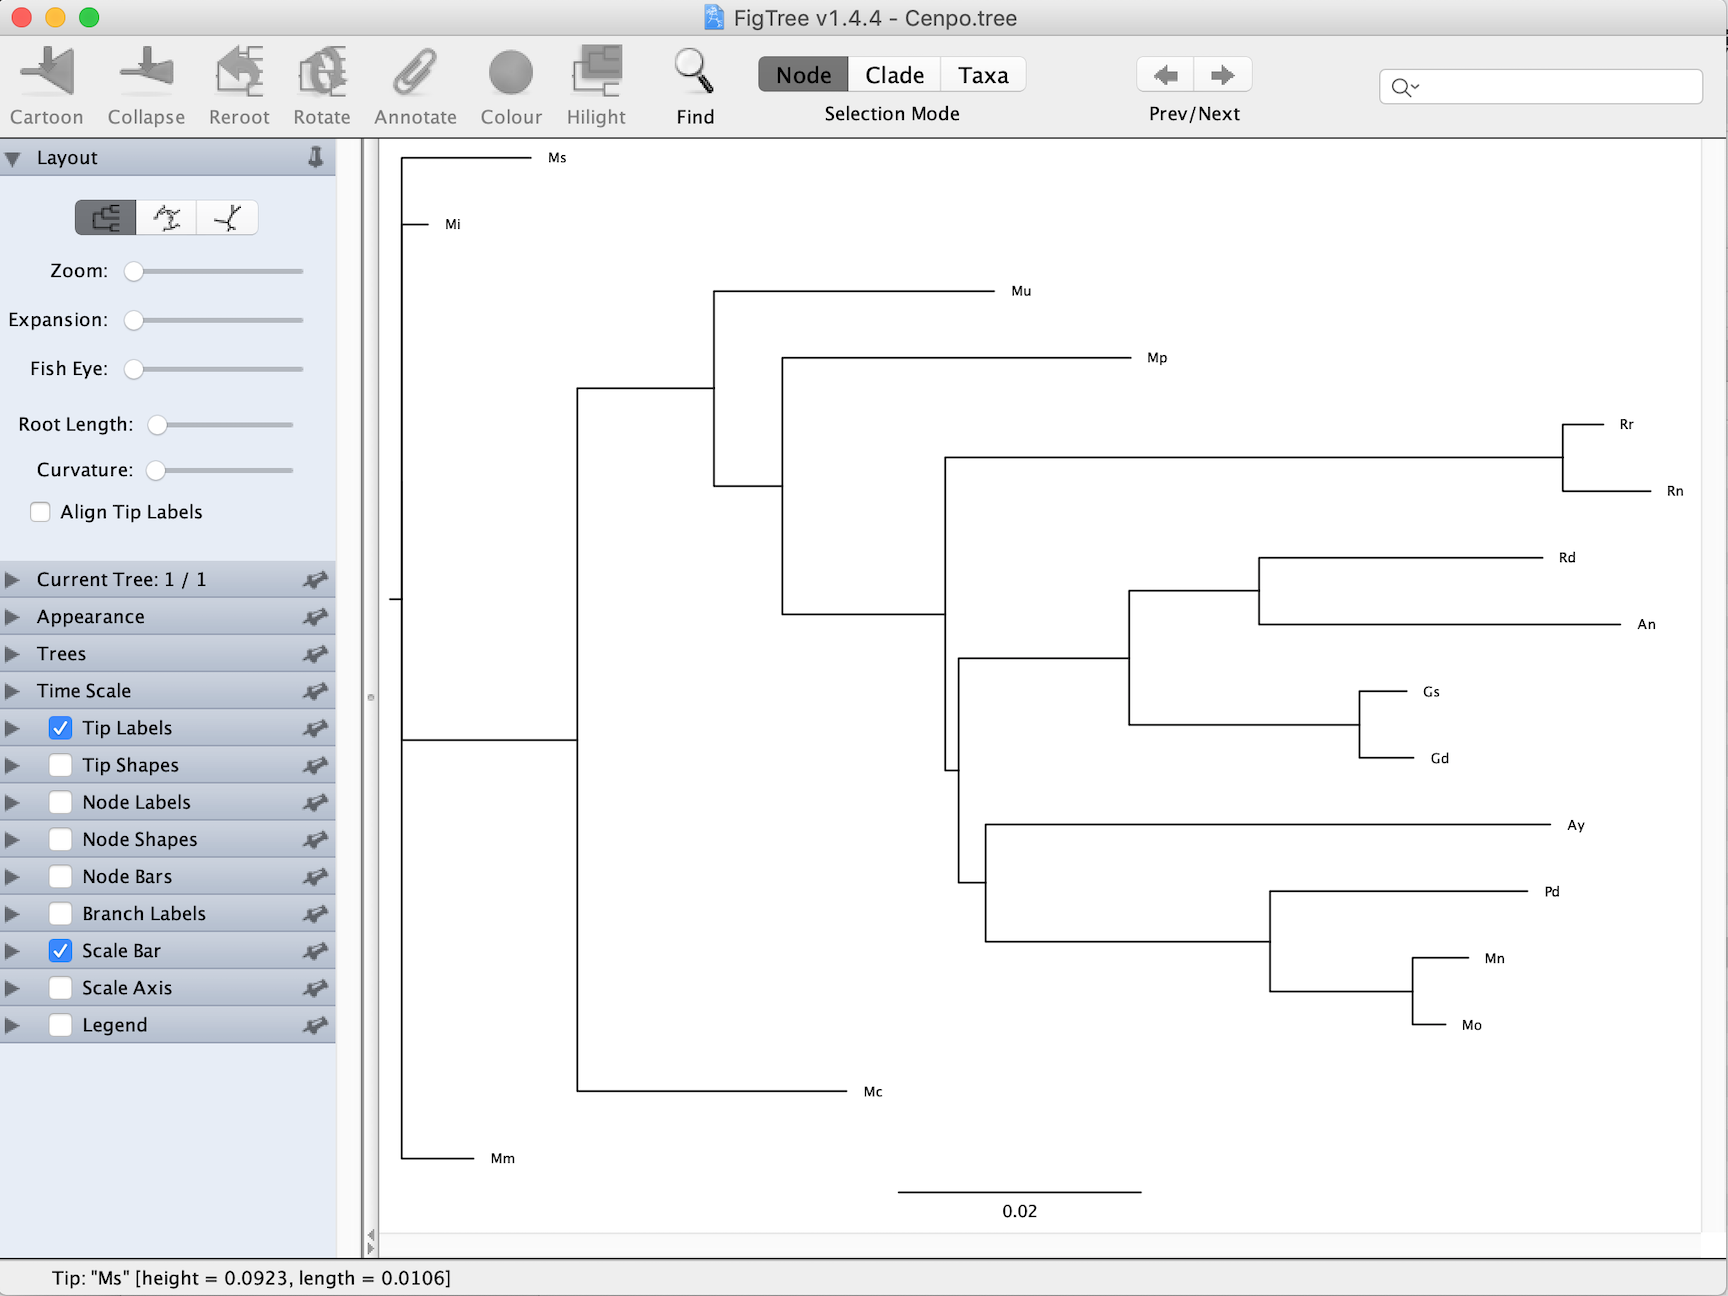
Exemplary gene tree (viewed in Figtree)
Cenpo.tree
Results worksheet (viewed in Excel)
PAML_result-10-31-2022-13-02_F3X4.xlsx

Here you can find probabilities of positive selection acting on each recurrently changing residue (displayed on top).
Residues under positive selection mapped onto referene CDS (viewed in Preview)
Cenpo_PAML_graph_F3X4.tif
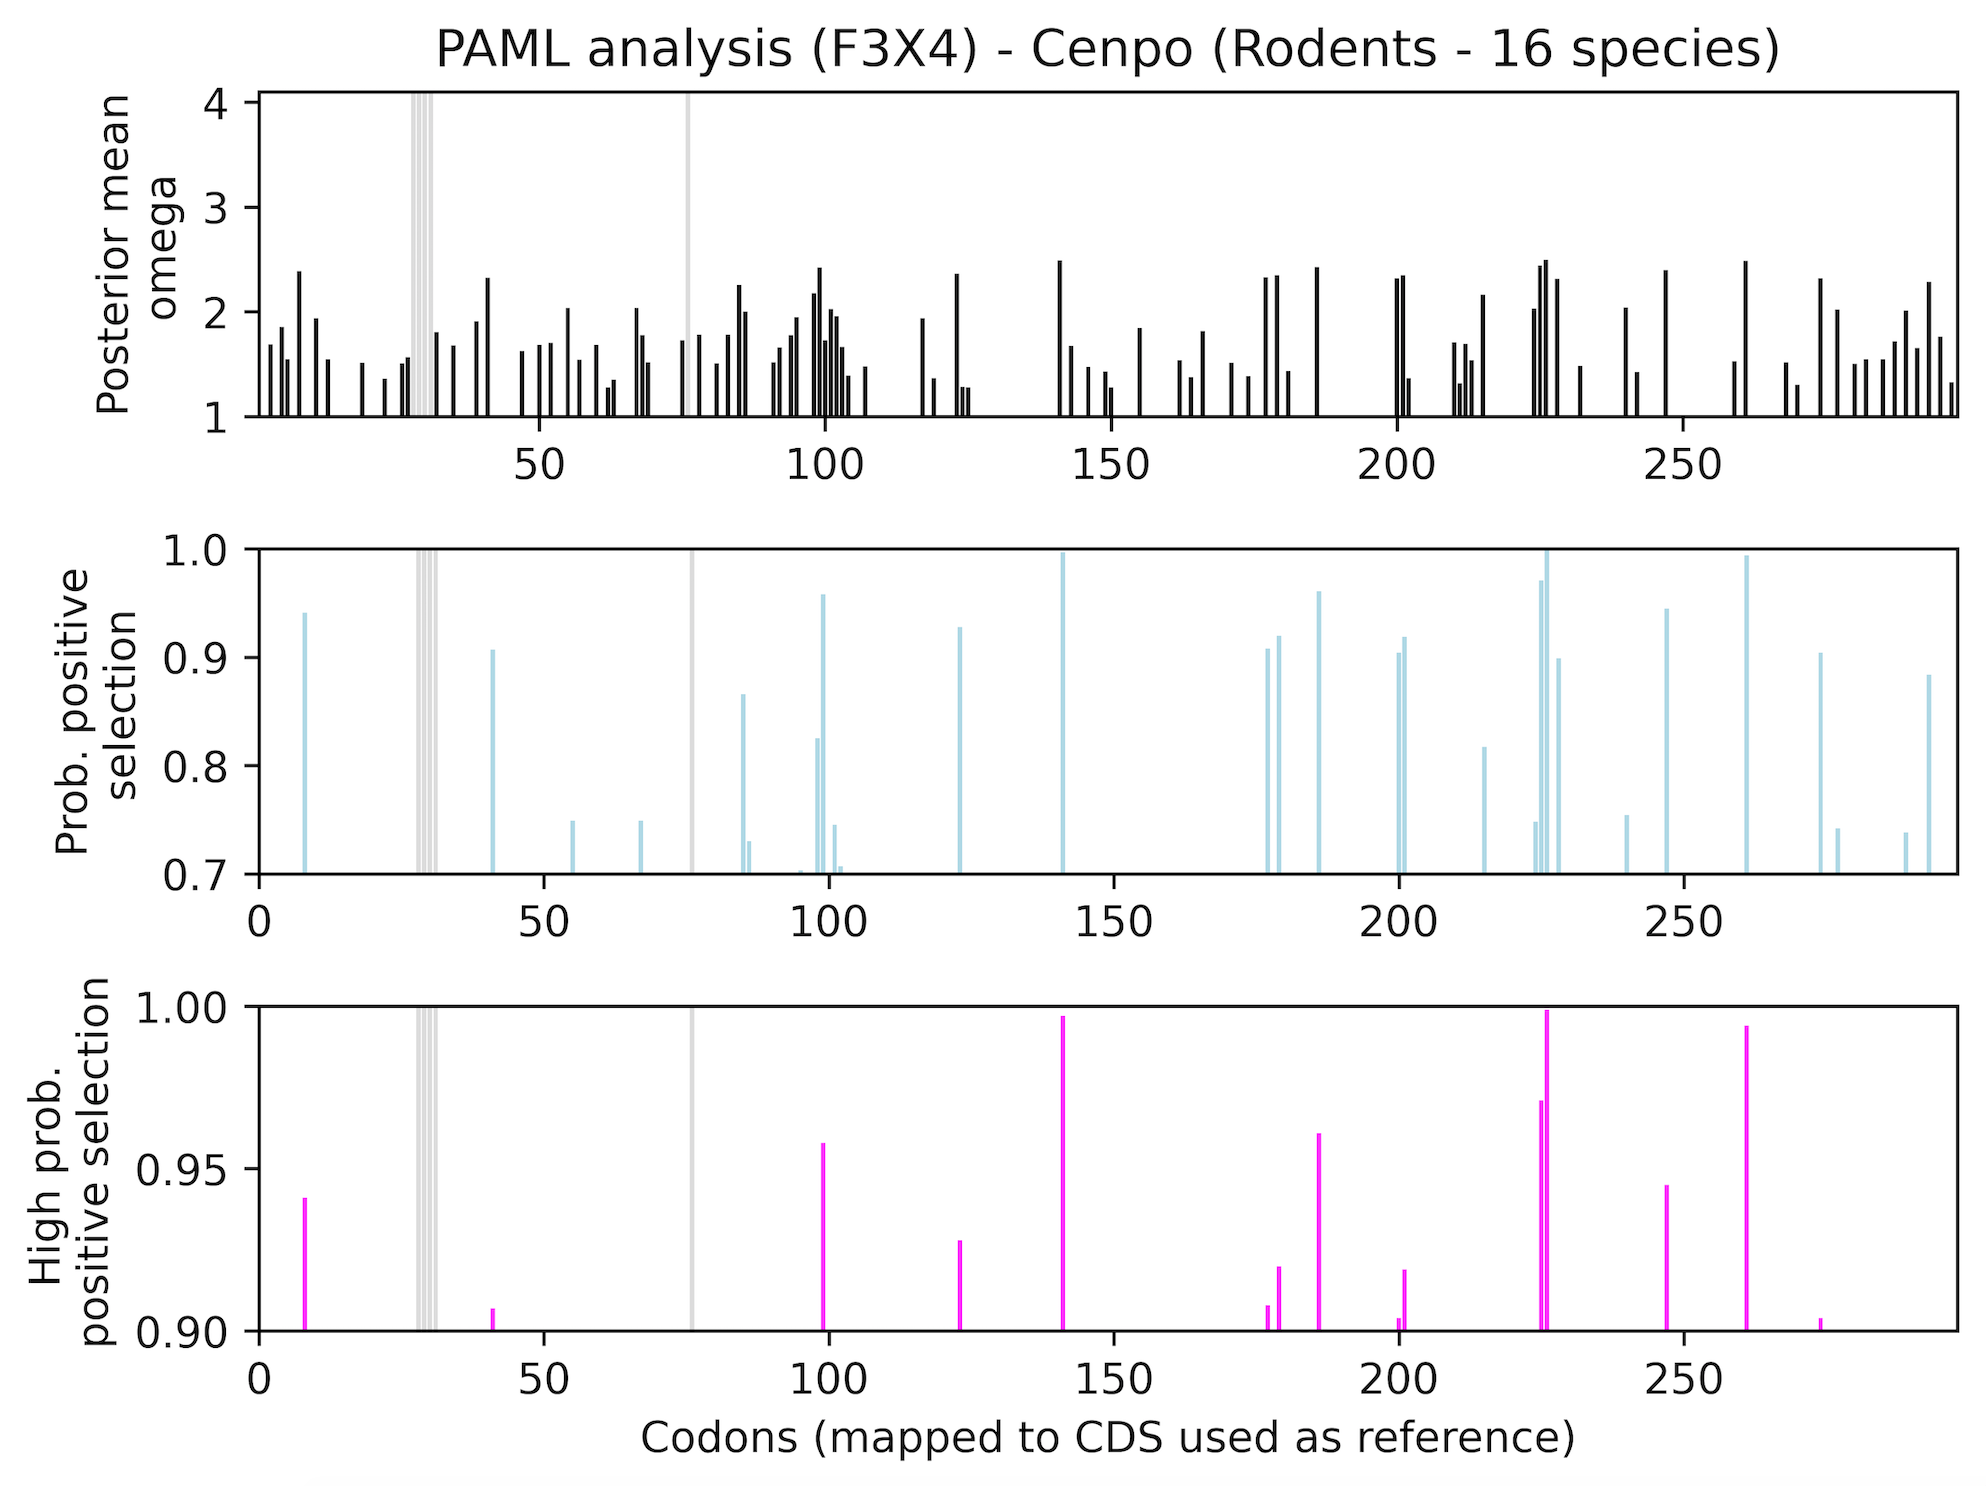
Top graph (black) shows recurrently changing residues. Middle graph (blue) shows residues that evolve under positive selection with more or less probability (0-7-1.0). Bottom graph (magenta) shows residues with the highest probability of evolving under positive selection. Gray regions have been excluded from analysis (e.g. indels).
Residues under positive selection mapped onto structural prediction (viewed in PyMOL)
Cenpo_Mm.pse
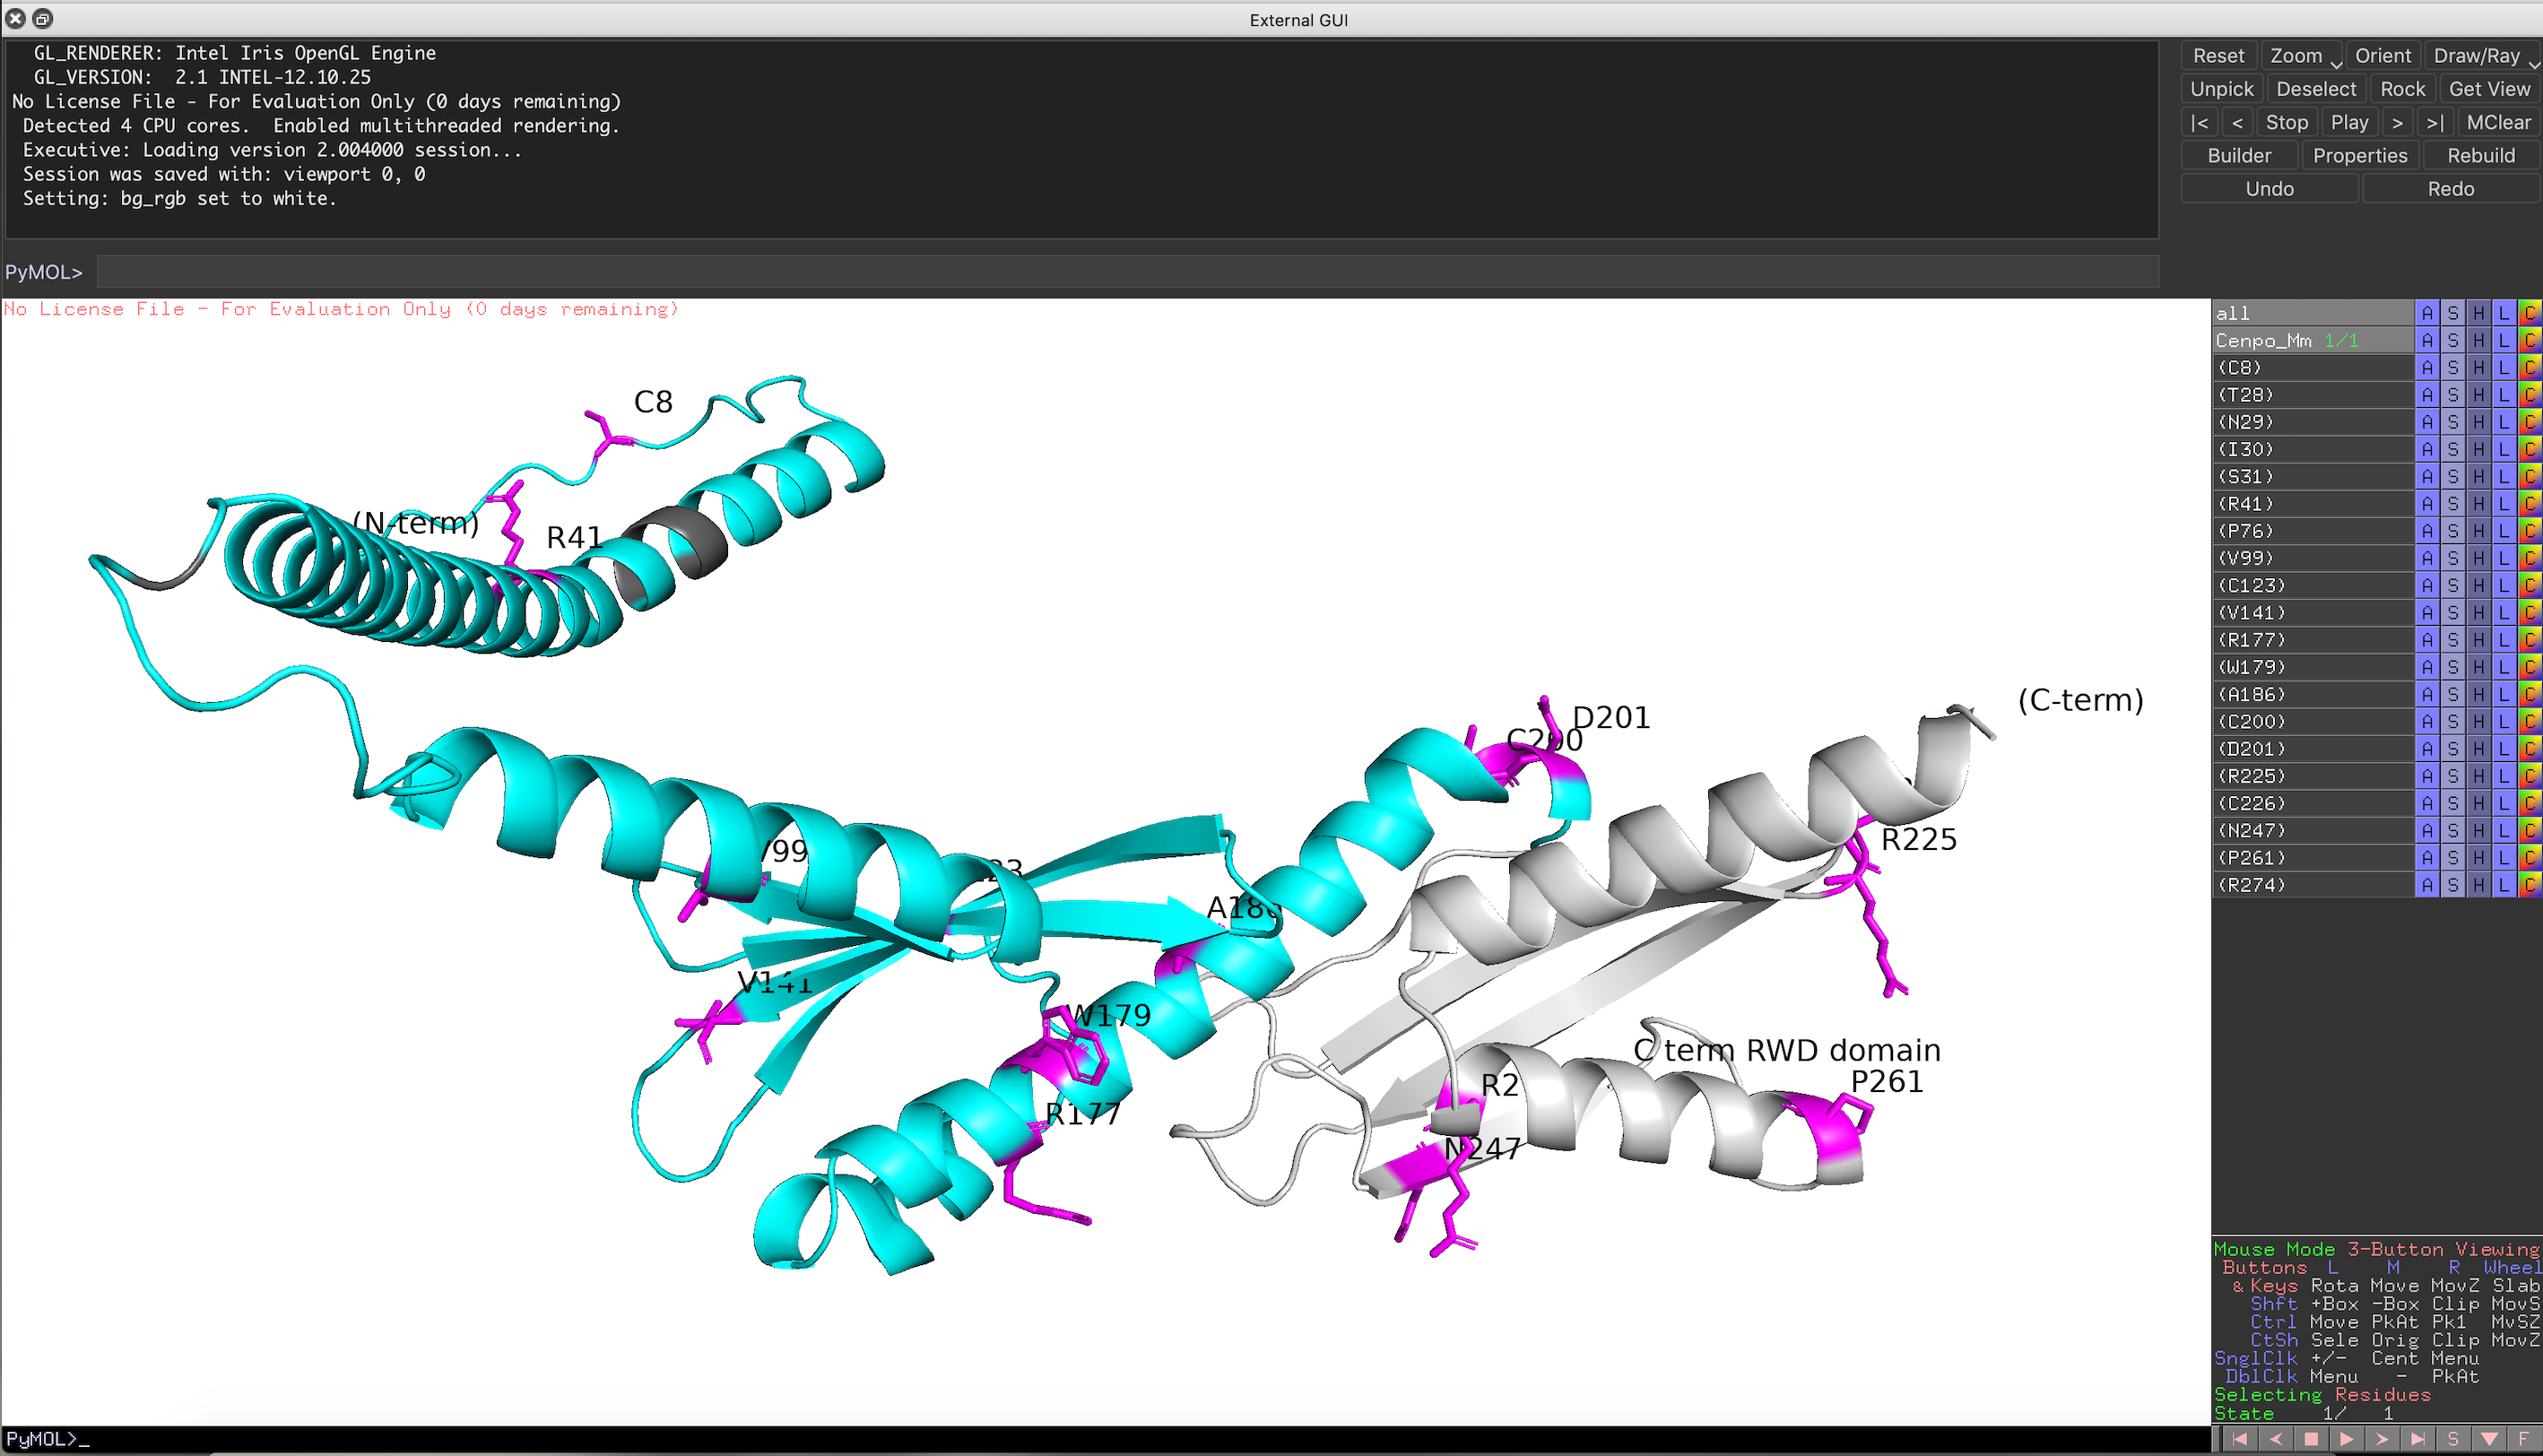
You can rotate the structure to have a better look at the position of each residue under positive selection. For details on how to further analyze your structure see: PyMOL wiki https://pymolwiki.org/index.php/Practical_Pymol_for_Beginners and useful user guide: https://pymol.sourceforge.net/newman/userman.pdf